Fig. B.1
Download original image
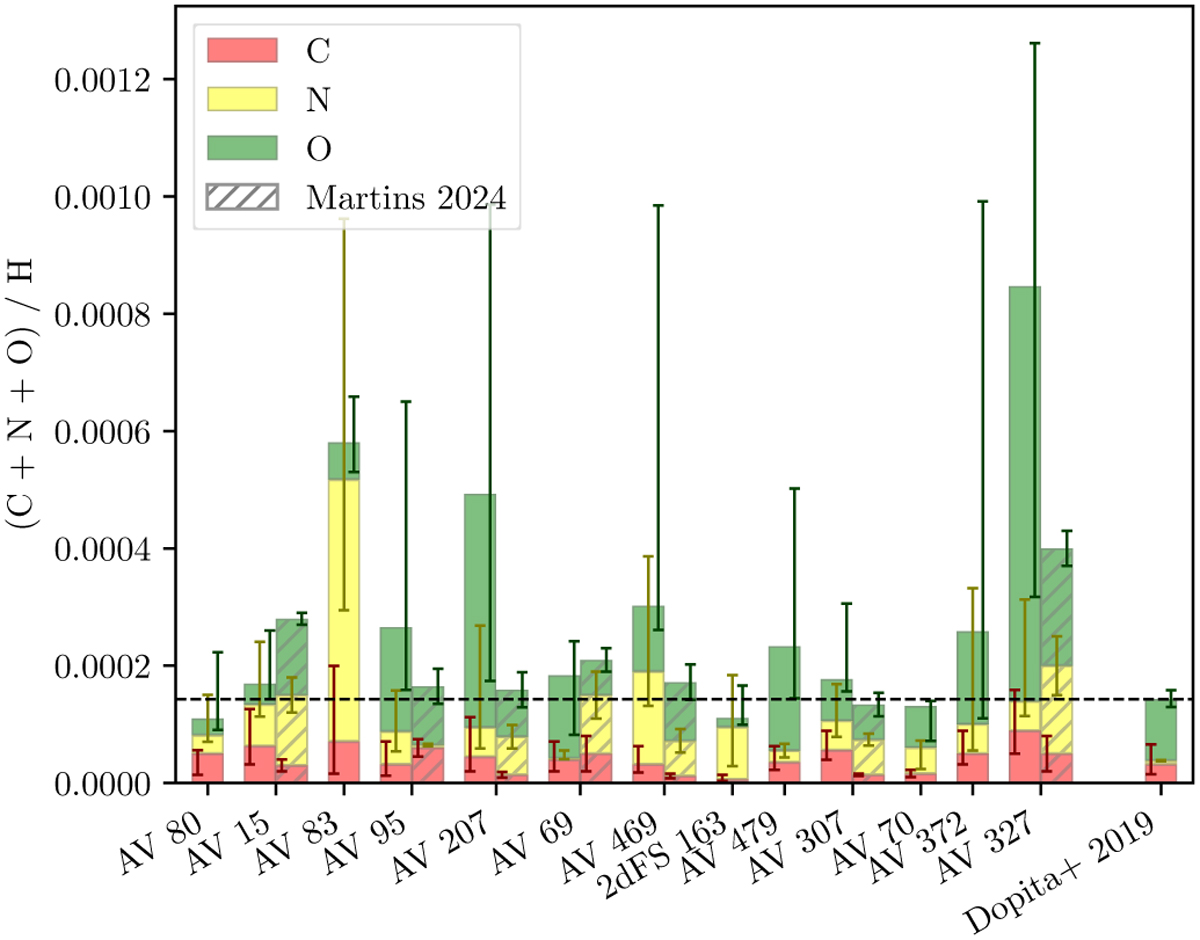
Total carbon, nitrogen, and oxygen abundances for each star, broken down in the separate components. In each bar the uncertainties of the carbon (left), nitrogen (middle), and oxygen abundances are shown. Stars from Martins et al. (2024) that overlap with our sample are shown in the hatched bars. The horizontal dashed line shows the total baseline abundance from Dopita et al. (2019), which is also broken down in the separate components on the right.
Current usage metrics show cumulative count of Article Views (full-text article views including HTML views, PDF and ePub downloads, according to the available data) and Abstracts Views on Vision4Press platform.
Data correspond to usage on the plateform after 2015. The current usage metrics is available 48-96 hours after online publication and is updated daily on week days.
Initial download of the metrics may take a while.