Fig. A.2
Download original image
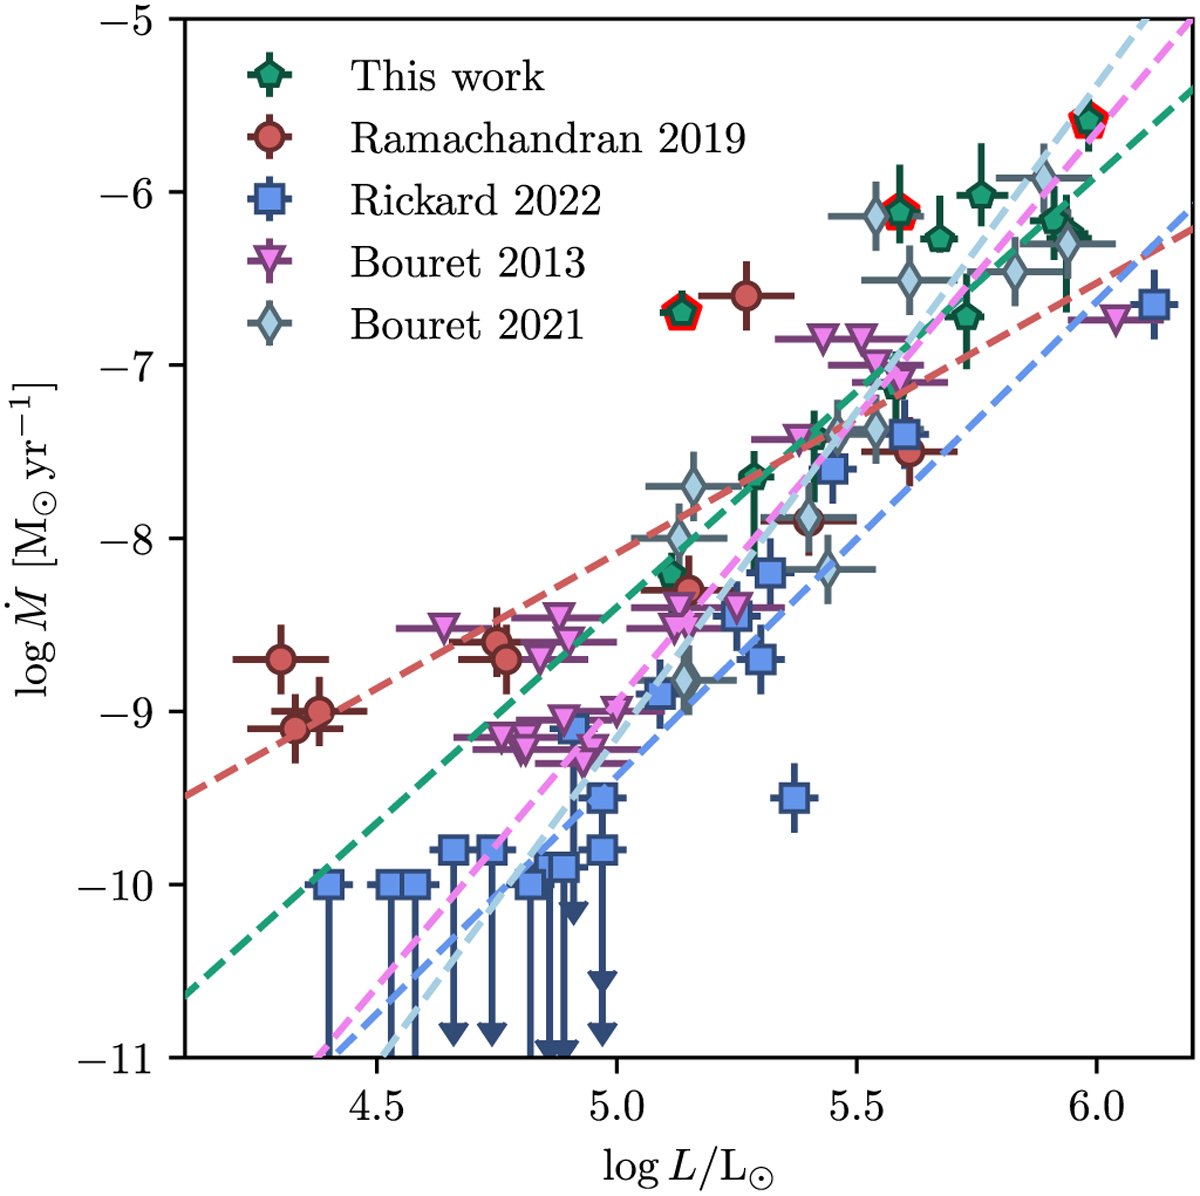
Mass-loss rate plotted against luminosity for SMC stars from Ramachandran et al. (2019), Rickard et al. (2022), and this work. The dotted line indicates a linear fit to the data points. The upper limits from Rickard et al. (2022) are not considered in the linear fit, neither are stars with a luminosity log L/L⊙ < 5 from Bouret et al. (2013). Stars with poor fits, outlined in red here, are not included in the linear fits.
Current usage metrics show cumulative count of Article Views (full-text article views including HTML views, PDF and ePub downloads, according to the available data) and Abstracts Views on Vision4Press platform.
Data correspond to usage on the plateform after 2015. The current usage metrics is available 48-96 hours after online publication and is updated daily on week days.
Initial download of the metrics may take a while.