Fig. 1
Download original image
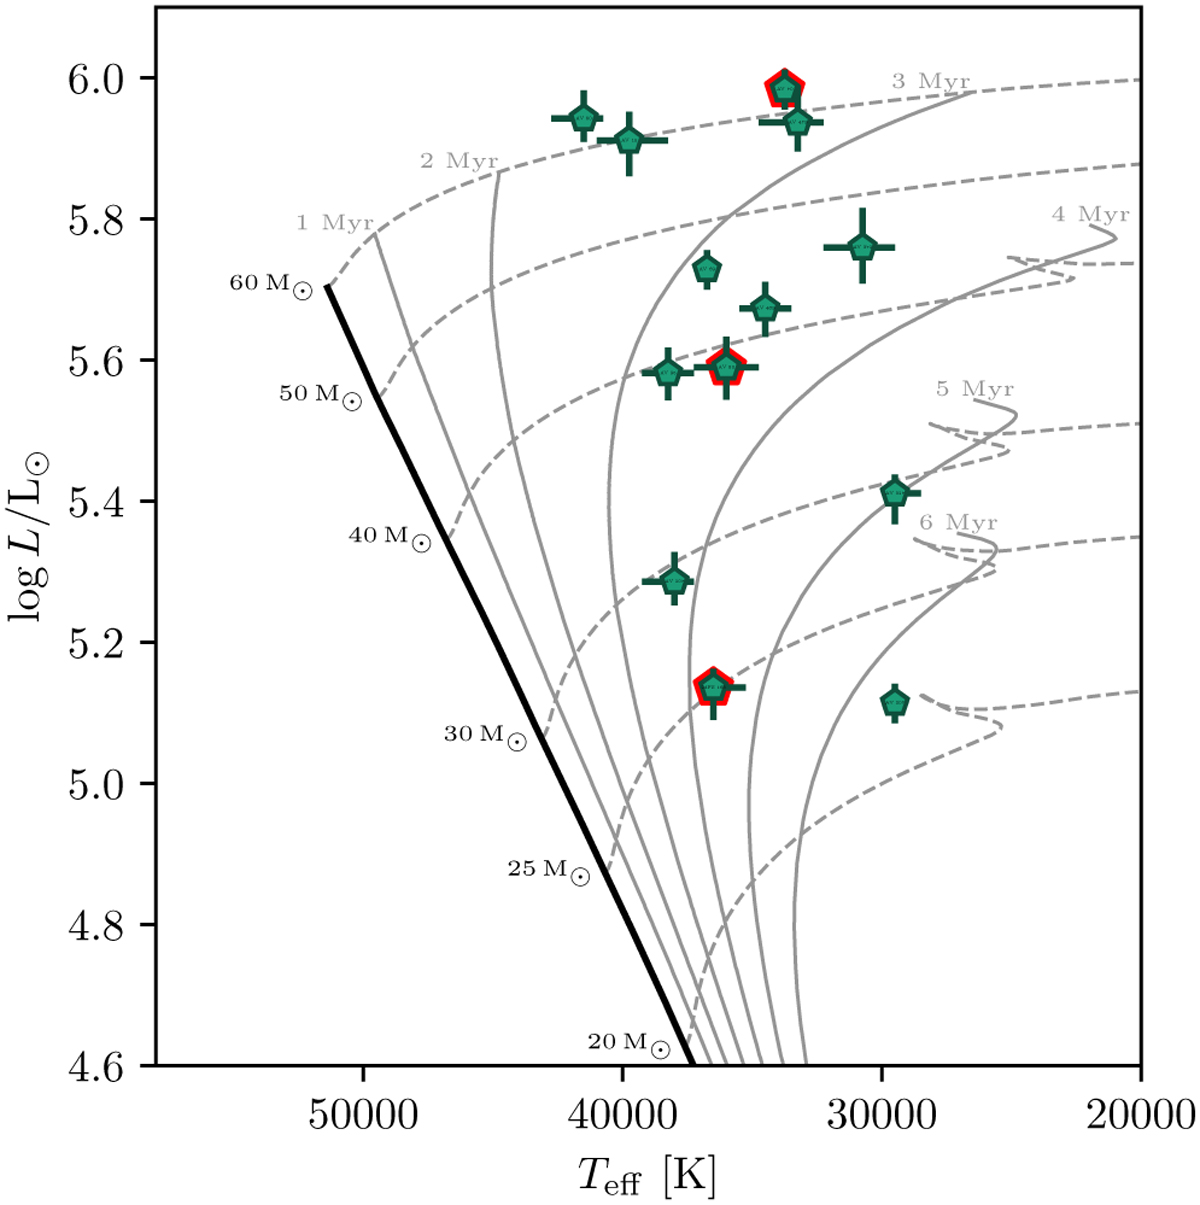
Hertzsprung-Russell diagram of our SMC sample of stars with temperatures and luminosities resulting from the fit. Points with a red border indicate stars with unreliable parameters. We overplot the evolutionary tracks (thin solid gray lines) and isochrones (thin dashed gray lines) of Brott et al. (2011). The solid black line indicates the zero-age main sequence. The points are labeled with the name of the object in a small font that is visible when zoomed in.
Current usage metrics show cumulative count of Article Views (full-text article views including HTML views, PDF and ePub downloads, according to the available data) and Abstracts Views on Vision4Press platform.
Data correspond to usage on the plateform after 2015. The current usage metrics is available 48-96 hours after online publication and is updated daily on week days.
Initial download of the metrics may take a while.