Fig. 6
Download original image
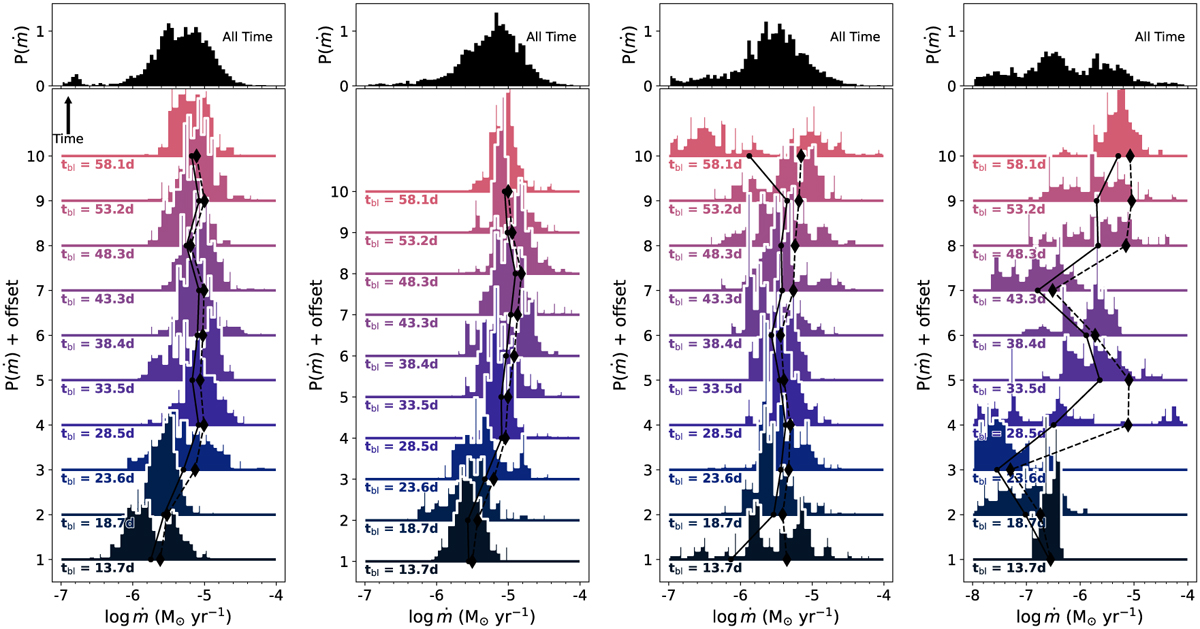
Distribution of the total accretion rate over ≈5-day blocks for the 10 G (left) 500 G (middle left) and 1000 G (middle right) and 2000 G (right)protostars. The black points are the logarithmic average of the accretion rate and the diamonds are the time-averaged, e.g., 〈ṁ*〉bl = macc/Twindow, where macc is the accretion mass during that block. Annotated is the block number (also denoted by color), and the time in the center of the block in days.
Current usage metrics show cumulative count of Article Views (full-text article views including HTML views, PDF and ePub downloads, according to the available data) and Abstracts Views on Vision4Press platform.
Data correspond to usage on the plateform after 2015. The current usage metrics is available 48-96 hours after online publication and is updated daily on week days.
Initial download of the metrics may take a while.