Open Access
Fig. 14
Download original image
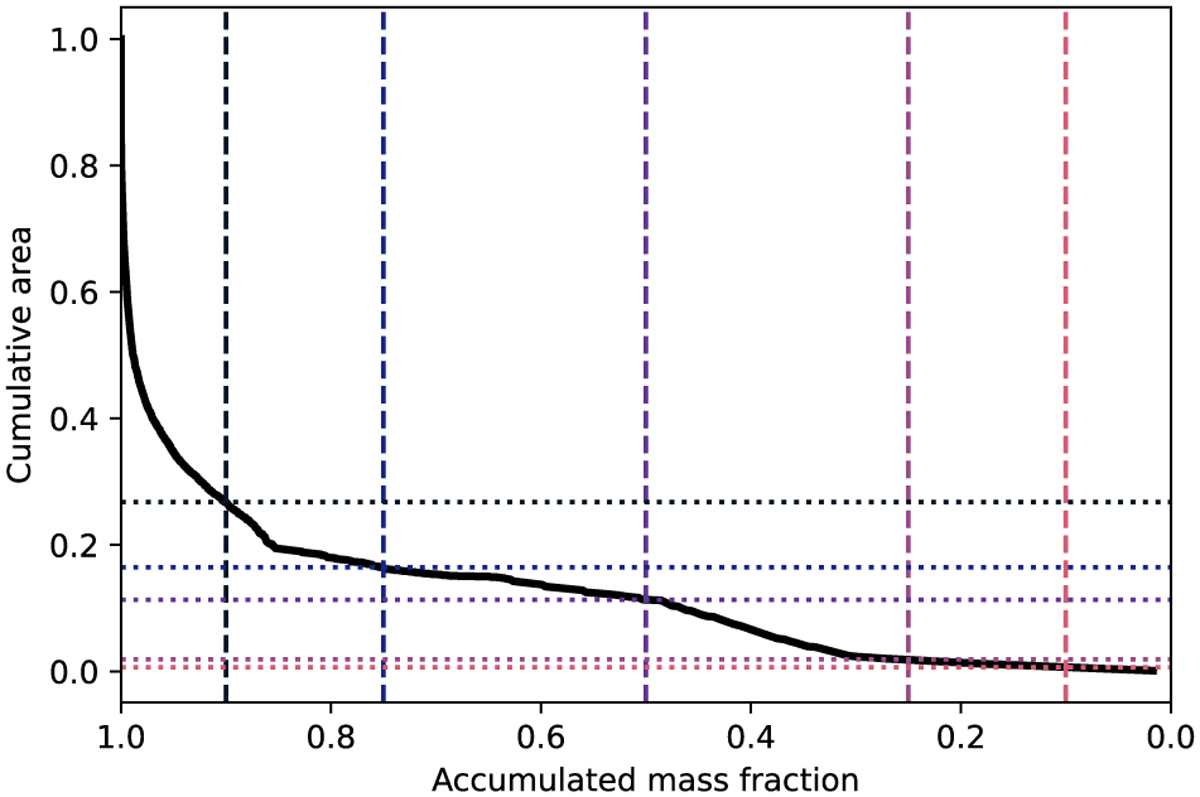
Accumulated mass fraction percentage versus the cumulative area of the protostar surface for the snapshot in Figure 13. The horizontal lines show the index at which the top 10%, 25%, 50%, 75%, and 90% of the mass is accreted.
Current usage metrics show cumulative count of Article Views (full-text article views including HTML views, PDF and ePub downloads, according to the available data) and Abstracts Views on Vision4Press platform.
Data correspond to usage on the plateform after 2015. The current usage metrics is available 48-96 hours after online publication and is updated daily on week days.
Initial download of the metrics may take a while.