Open Access
Fig. A.1.
Download original image
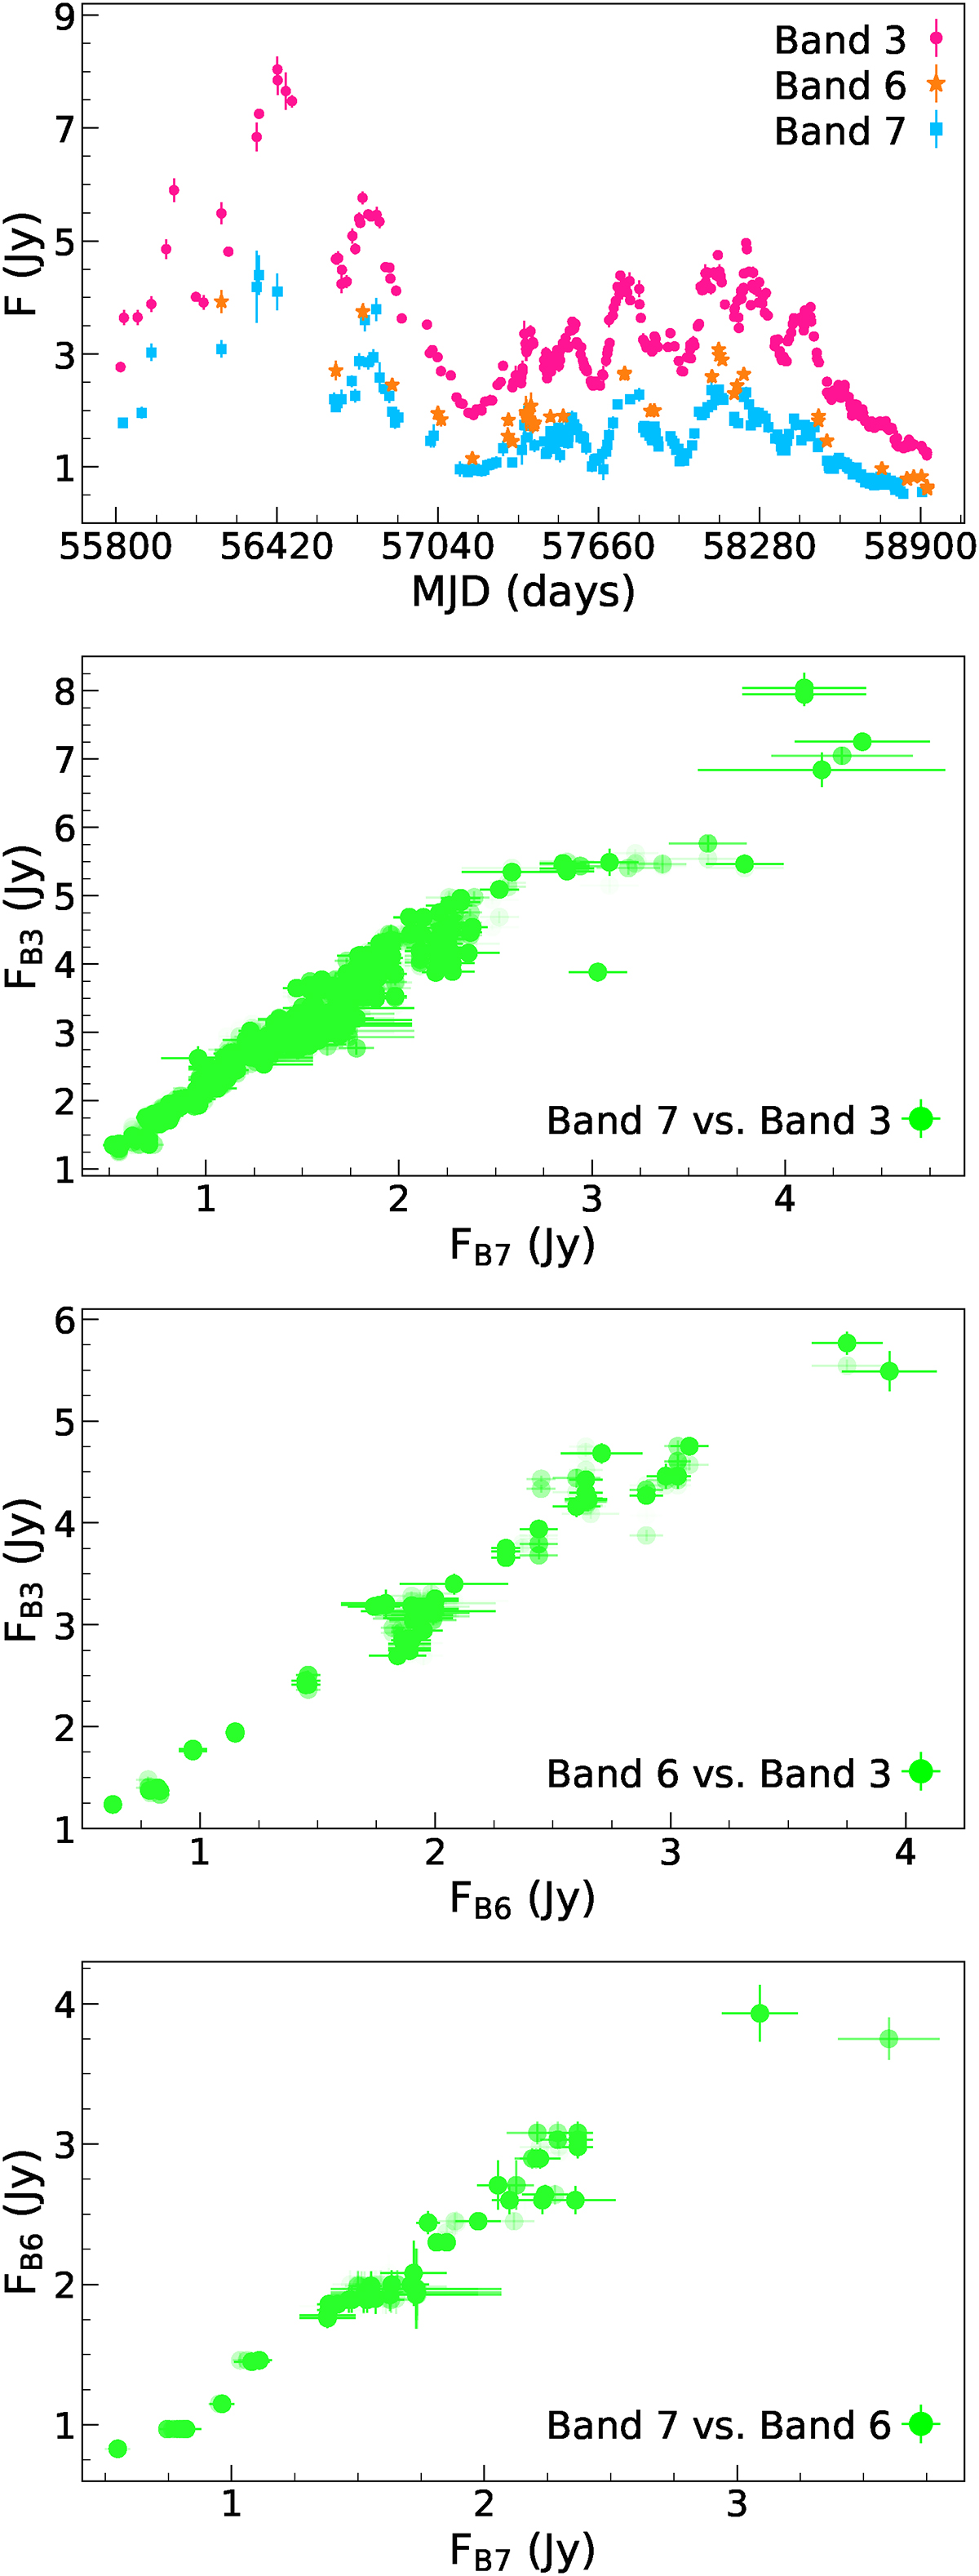
From top to bottom: ALMA light curves of PKS 1424−418 at band 3 (95 GHz), band 6 (235 GHz), and band 7 (345 GHz) and plots of the flux–flux scatter (∼930 samples for B7–B3 & ∼830 samples for the others) for each pair of the ALMA bands.
Current usage metrics show cumulative count of Article Views (full-text article views including HTML views, PDF and ePub downloads, according to the available data) and Abstracts Views on Vision4Press platform.
Data correspond to usage on the plateform after 2015. The current usage metrics is available 48-96 hours after online publication and is updated daily on week days.
Initial download of the metrics may take a while.