Open Access
Fig. 5.
Download original image
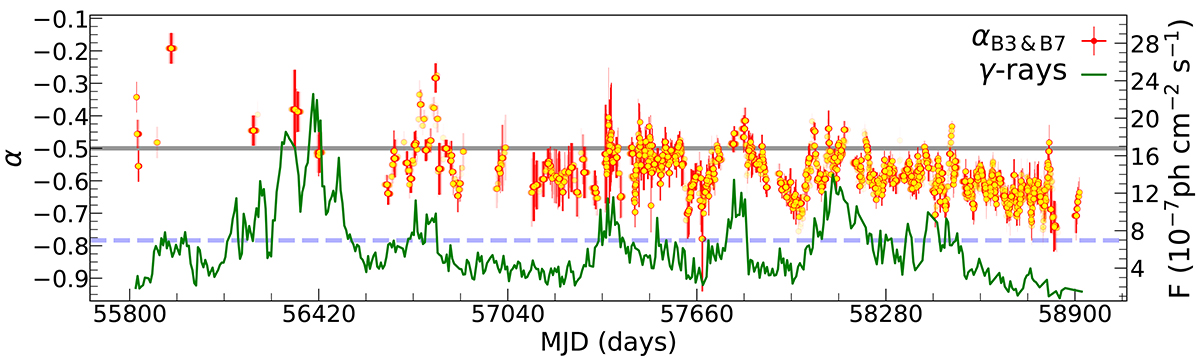
Evolution of the (sub)mm wave radio spectral index (α) between ALMA bands 3 and 7 (i.e., 95 GHz vs. 345 GHz). The horizontal gray line points to α = −0.5. The γ-ray light curve is overlaid in the background for comparison. The horizontal blue line denotes the threshold for the γ-ray flare.
Current usage metrics show cumulative count of Article Views (full-text article views including HTML views, PDF and ePub downloads, according to the available data) and Abstracts Views on Vision4Press platform.
Data correspond to usage on the plateform after 2015. The current usage metrics is available 48-96 hours after online publication and is updated daily on week days.
Initial download of the metrics may take a while.