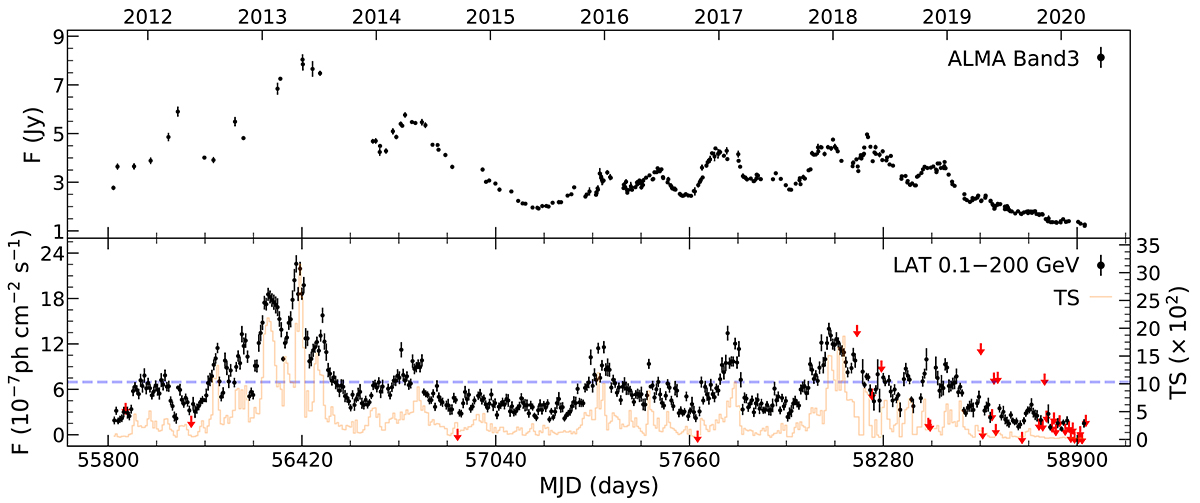
Fig. 2.
Download original image
ALMA band 3 (95 GHz) light curve (upper) and 6-day-binned LAT γ-ray light curve (lower) of PKS 1424−418 in 2011–2020 (∼8.5 yr). The red arrows indicate the 2σ upper limits of the γ-rays. The detection of γ-ray photons in terms of TS is shown as the light orange line. The horizontal blue line denotes the threshold for the γ-ray flare.
Current usage metrics show cumulative count of Article Views (full-text article views including HTML views, PDF and ePub downloads, according to the available data) and Abstracts Views on Vision4Press platform.
Data correspond to usage on the plateform after 2015. The current usage metrics is available 48-96 hours after online publication and is updated daily on week days.
Initial download of the metrics may take a while.