Open Access
Fig. 2.
Download original image
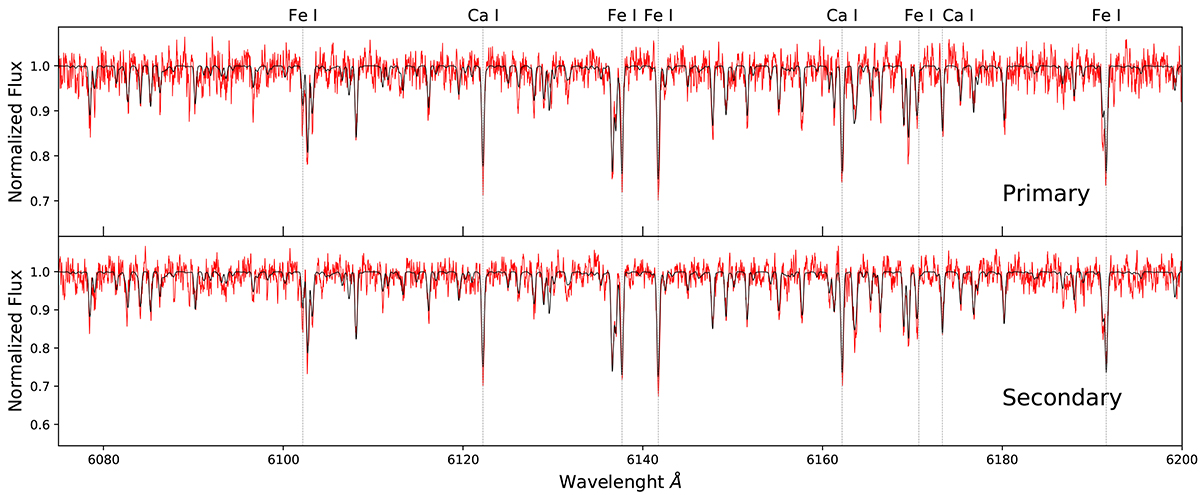
6080–6200 Å spectral region of the object LMC25304. The red lines are the disentangled spectra from MIKE-red observations. The black lines are the synthetic spectra generated using the GSSP binary mode.
Current usage metrics show cumulative count of Article Views (full-text article views including HTML views, PDF and ePub downloads, according to the available data) and Abstracts Views on Vision4Press platform.
Data correspond to usage on the plateform after 2015. The current usage metrics is available 48-96 hours after online publication and is updated daily on week days.
Initial download of the metrics may take a while.