Open Access
Fig. 7
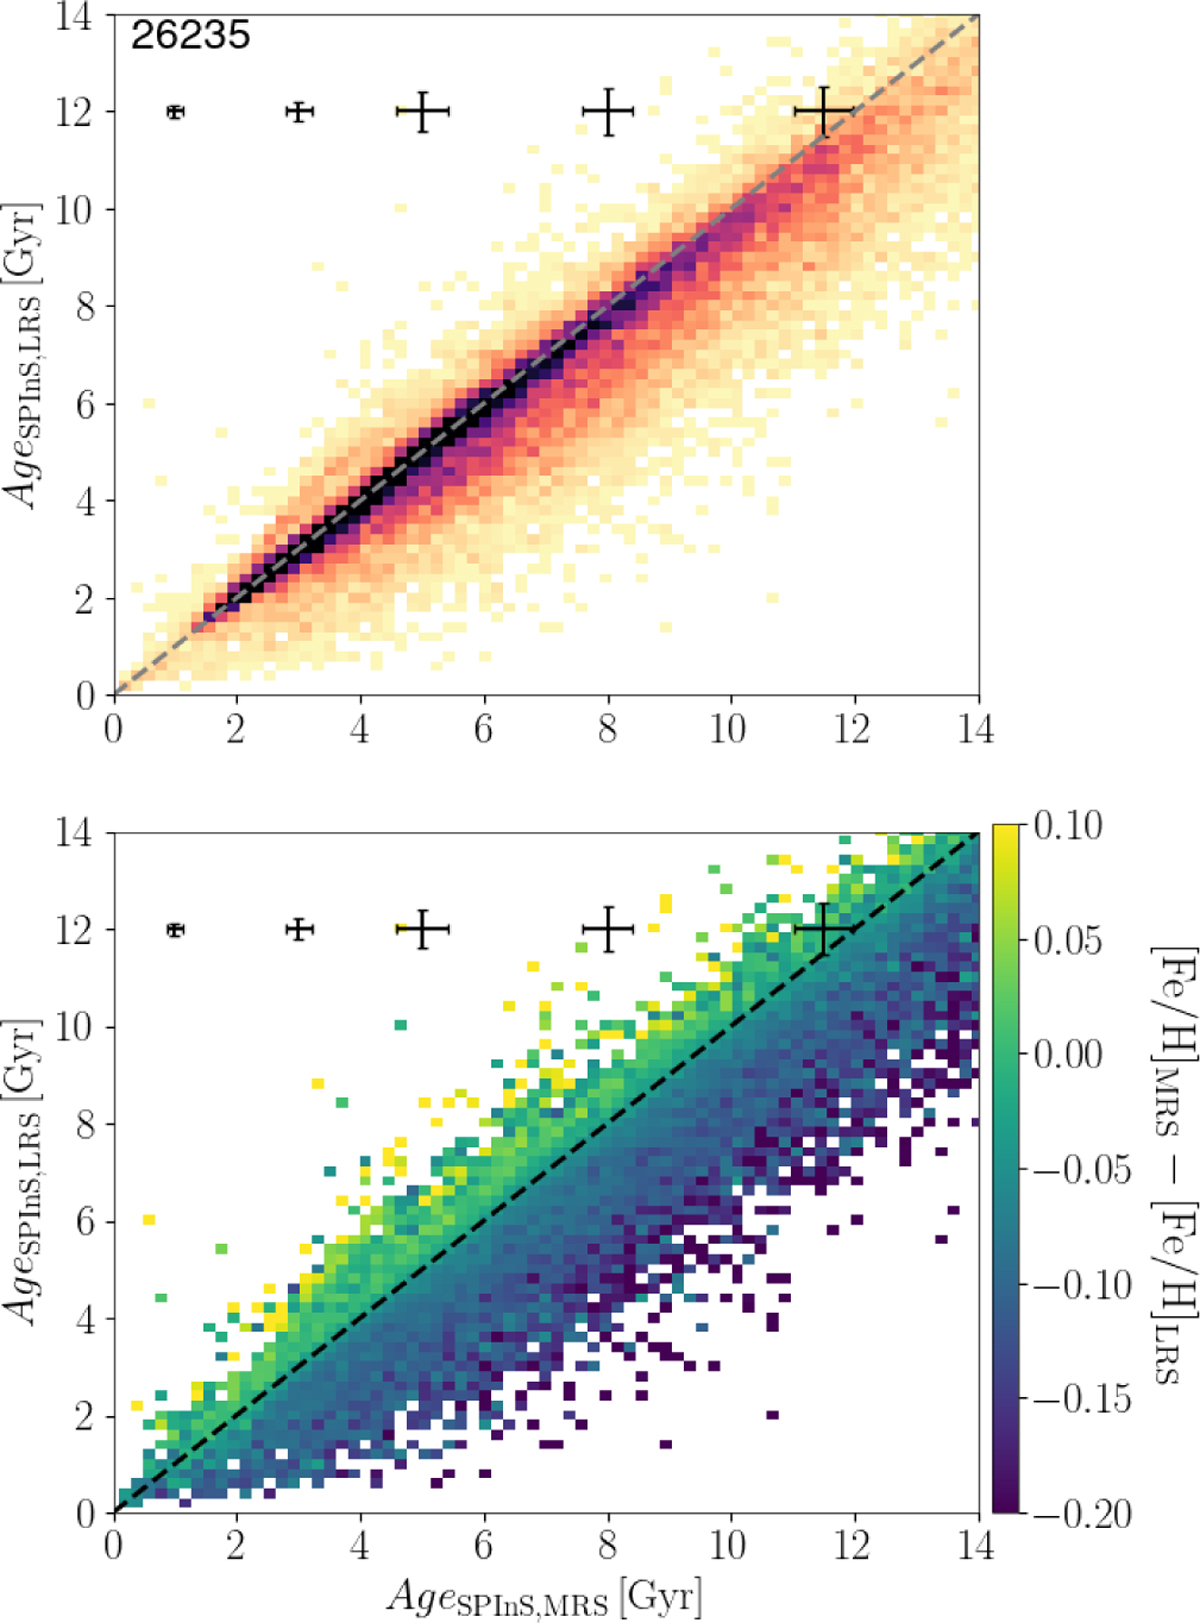
Download original image
Comparison of the ages from the MRS-LASP and LRS samples obtained by SPInS. The number of stars is indicated in the plot, and median quoted errors per age bin are plotted. The top plot is coloured by density, and the bottom plot by the difference in metallicity.
Current usage metrics show cumulative count of Article Views (full-text article views including HTML views, PDF and ePub downloads, according to the available data) and Abstracts Views on Vision4Press platform.
Data correspond to usage on the plateform after 2015. The current usage metrics is available 48-96 hours after online publication and is updated daily on week days.
Initial download of the metrics may take a while.