Fig. 2
Download original image
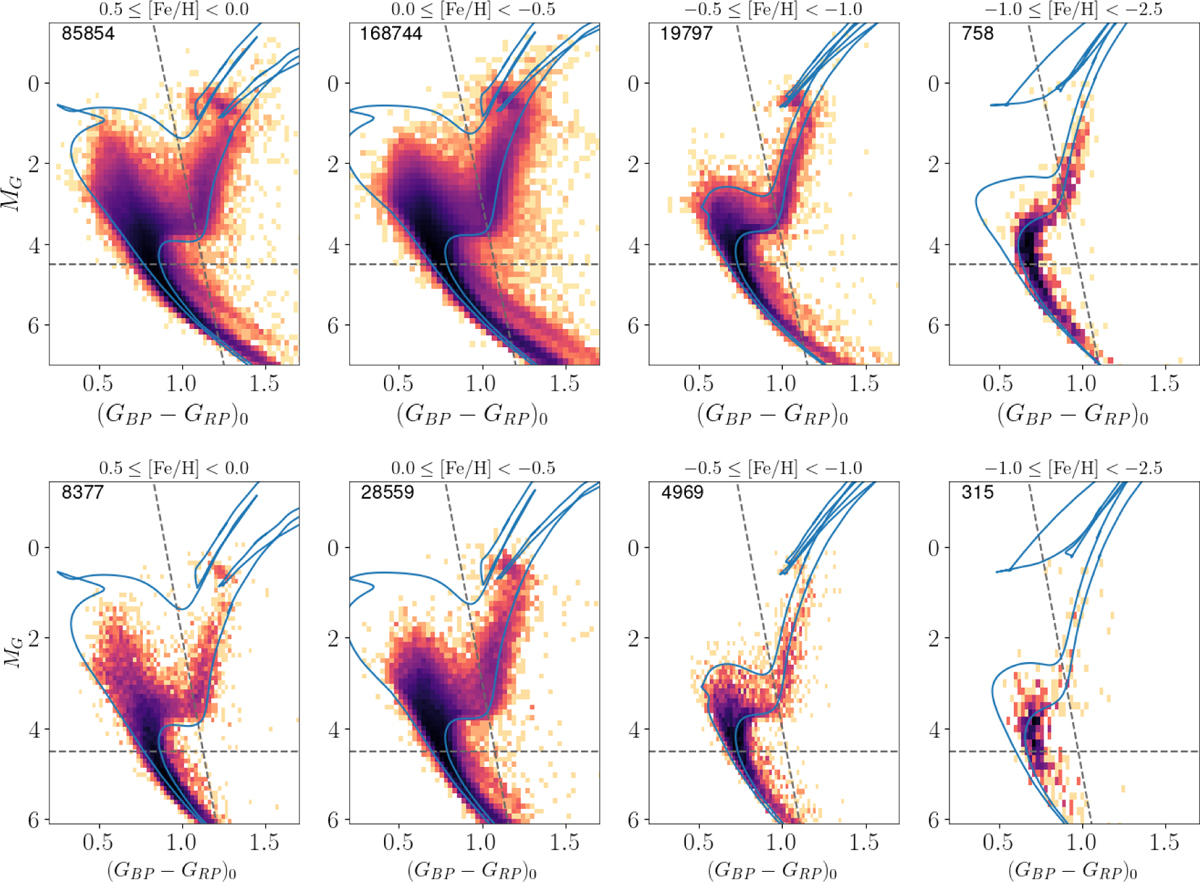
Intrinsic CMD of the initial sample of LRS (top) and MRS (bottom) stars, divided in four [Fe/H] bins, coloured by the density of stars (logarithmic scale). The number of stars is plotted in each panel. The grey lines represent the cuts done to select MSTO and SGB, as is explained in Sect. 3.3. To guide the eye, we additionally plot in blue two isochrones representative of each [Fe/H] bin at two different ages.
Current usage metrics show cumulative count of Article Views (full-text article views including HTML views, PDF and ePub downloads, according to the available data) and Abstracts Views on Vision4Press platform.
Data correspond to usage on the plateform after 2015. The current usage metrics is available 48-96 hours after online publication and is updated daily on week days.
Initial download of the metrics may take a while.