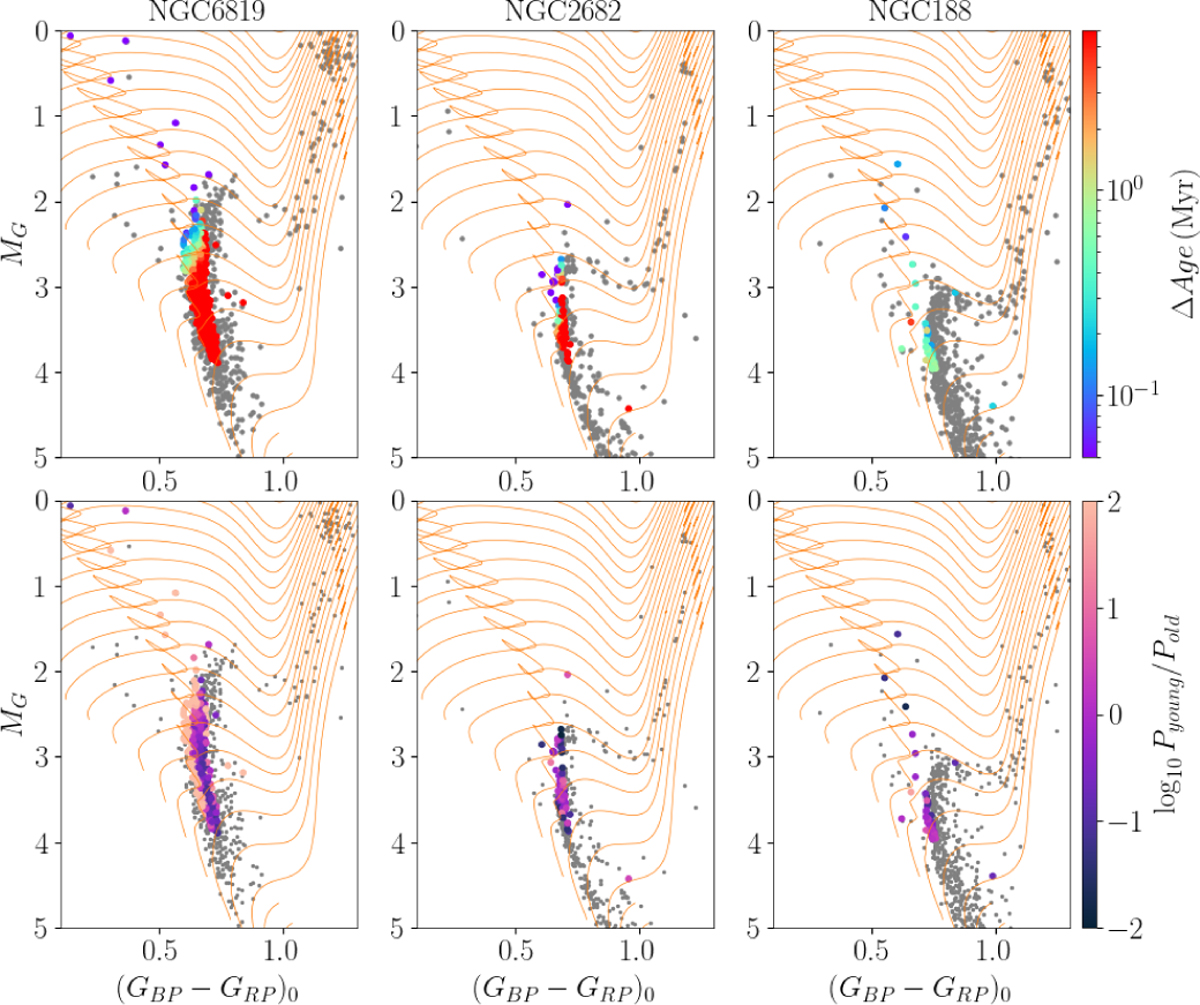
Fig. A.2
Download original image
CMD of the three intermediate-age clusters for which we find the most multiple solutions. Stars for which multiple peaks have been identified are plotted using coloured symbols according to the difference between the age of the most probable age peak and the mean literature age (top panels), and according to the probability ratio of the youngest to the oldest peak (bottom panels). Grey symbols depict stars with a single peak. BaSTI stellar tracks of metallicity −0.08 are shown using orange lines to guide the eye.
Current usage metrics show cumulative count of Article Views (full-text article views including HTML views, PDF and ePub downloads, according to the available data) and Abstracts Views on Vision4Press platform.
Data correspond to usage on the plateform after 2015. The current usage metrics is available 48-96 hours after online publication and is updated daily on week days.
Initial download of the metrics may take a while.