Fig. 13
Download original image
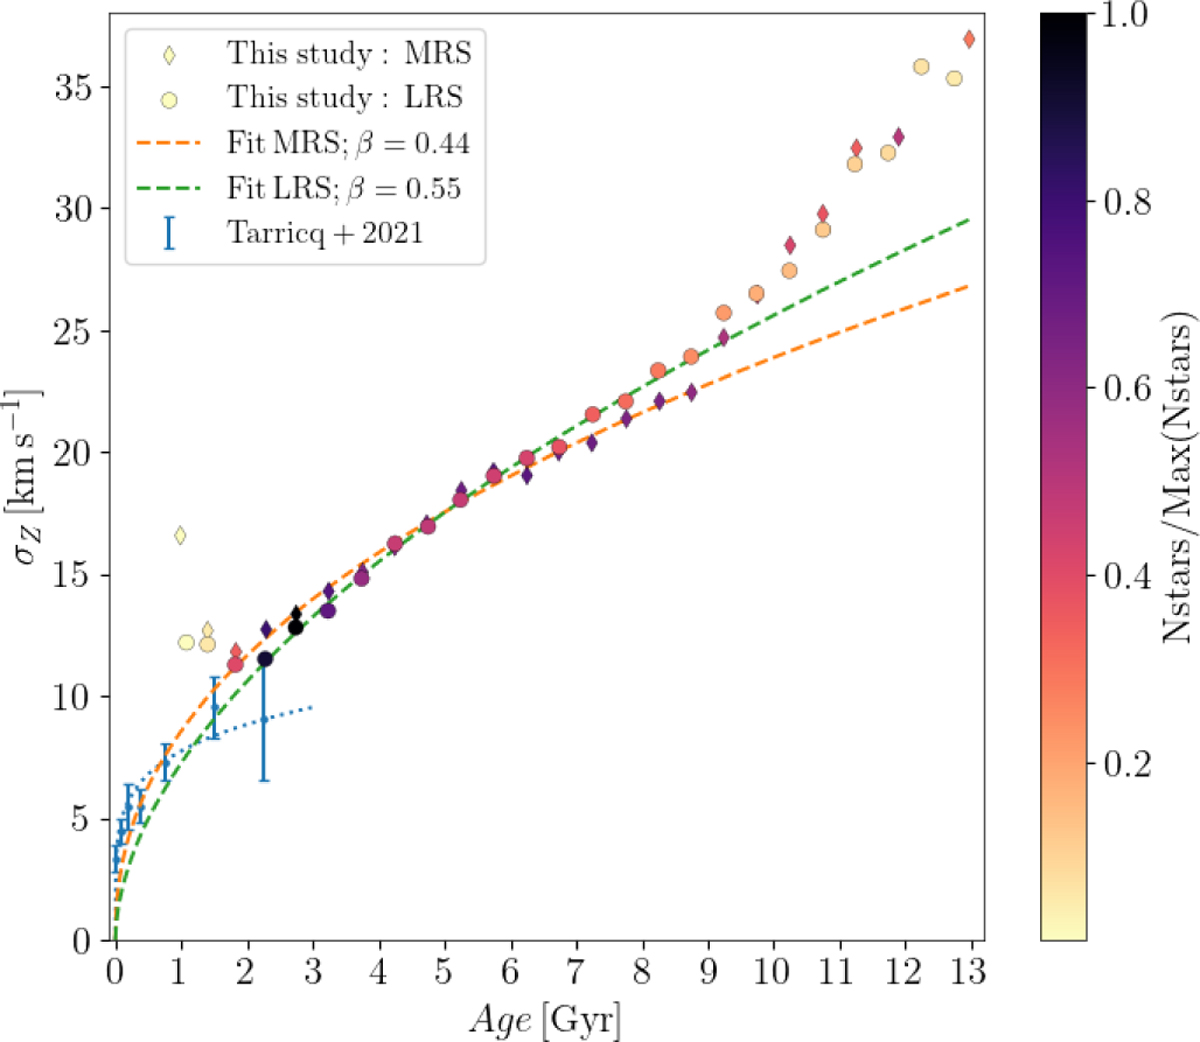
Age-velocity relation for the MRS and LRS samples coloured by the relative number of stars in each point (divided by the maximum). Power law fitting the 2 < Age < 9 Gyr range are plotted in orange and green dashed lines. A comparison with the AVR obtained for clusters in the solar neighbourhood (Tarricq et al. 2021) is shown in blue dots and their power-law fits in a blue dashed line.
Current usage metrics show cumulative count of Article Views (full-text article views including HTML views, PDF and ePub downloads, according to the available data) and Abstracts Views on Vision4Press platform.
Data correspond to usage on the plateform after 2015. The current usage metrics is available 48-96 hours after online publication and is updated daily on week days.
Initial download of the metrics may take a while.