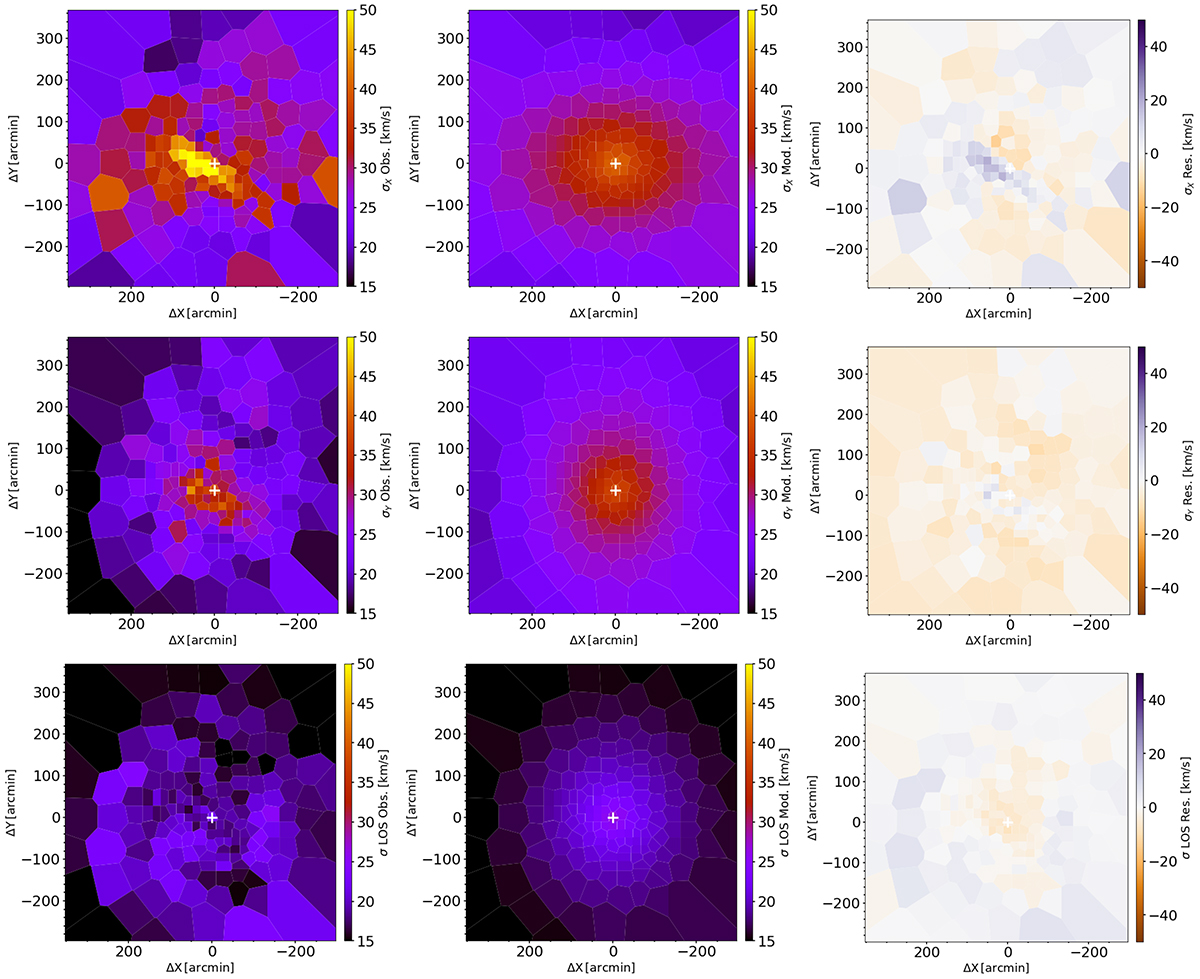
Fig. 8.
Download original image
Voronoi maps showing the 3D Jeans model fit to the LMC velocity dispersion field from the Gaia DR3 kinematic data. The first column represents the data in the X, Y, and LOS directions, respectively. Each Voronoi bin is colour-coded according to the maximum likelihood velocity dispersion of all stars that fall into it, taking into account their individual velocity uncertainties. The second column represents the Jeans model results and the third column the model residuals. PMs are converted into linear velocities. The velocity scale is kept constant amongst all maps for consistency and easier comparison.
Current usage metrics show cumulative count of Article Views (full-text article views including HTML views, PDF and ePub downloads, according to the available data) and Abstracts Views on Vision4Press platform.
Data correspond to usage on the plateform after 2015. The current usage metrics is available 48-96 hours after online publication and is updated daily on week days.
Initial download of the metrics may take a while.