Fig. 17.
Download original image
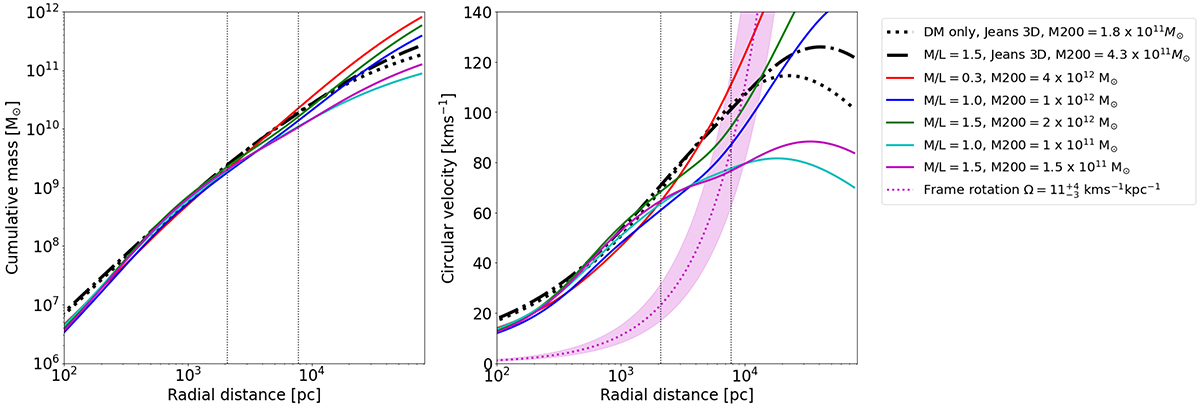
Dynamical models comparison. Left panel: Enclosed cumulative total mass profiles for select Schwarzschild dynamical models discussed in this work compared to the 3D Jeans models. Right panel: Corresponding circular velocity curves. We overplot the figure rotation rate for a bar pattern speed of 11 km s−1 kpc−1 (with a shaded region from 8 to 15 km s−1 kpc−1). The vertical lines correspond to the size of the LMC bar and the extent of our kinematic data. Everything beyond the second vertical line is an extrapolation of the model.
Current usage metrics show cumulative count of Article Views (full-text article views including HTML views, PDF and ePub downloads, according to the available data) and Abstracts Views on Vision4Press platform.
Data correspond to usage on the plateform after 2015. The current usage metrics is available 48-96 hours after online publication and is updated daily on week days.
Initial download of the metrics may take a while.