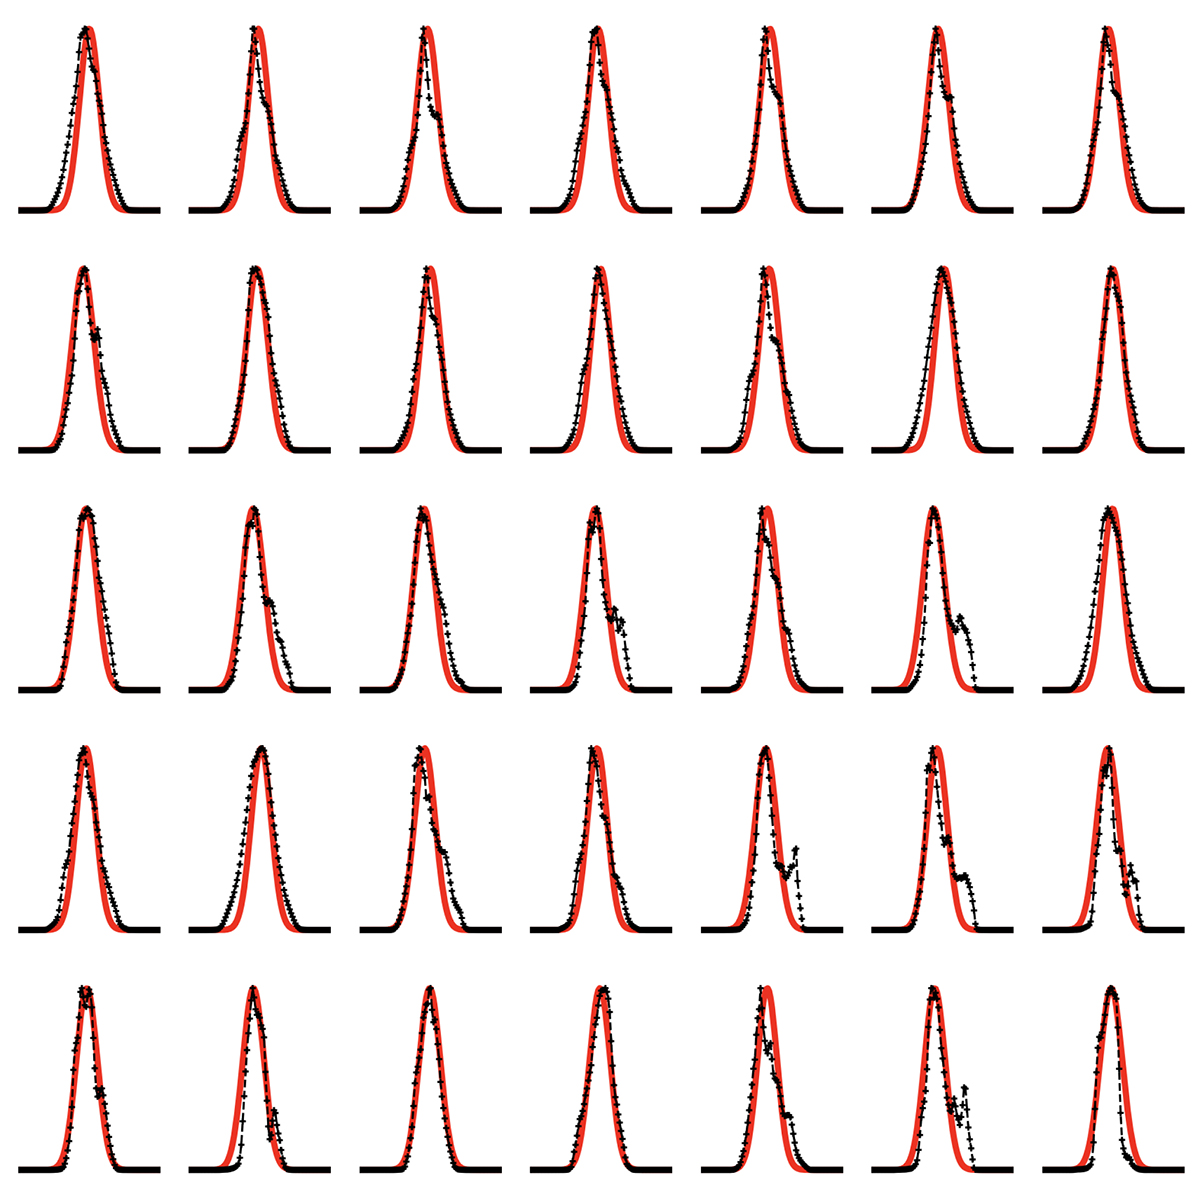
Fig. 15.
Download original image
Example LOSVD match between the input data (red) and the orbit superposition (black) for the 35 central Voronoi bins (out of 243). The input LOSVDs are represented by Gaussians, while the model LOSVDs are histograms with 200 velocity bins 3 km s−1 wide and constructed from all sampled points from the weighted orbit library that fall in the same projected Voronoi bins.
Current usage metrics show cumulative count of Article Views (full-text article views including HTML views, PDF and ePub downloads, according to the available data) and Abstracts Views on Vision4Press platform.
Data correspond to usage on the plateform after 2015. The current usage metrics is available 48-96 hours after online publication and is updated daily on week days.
Initial download of the metrics may take a while.