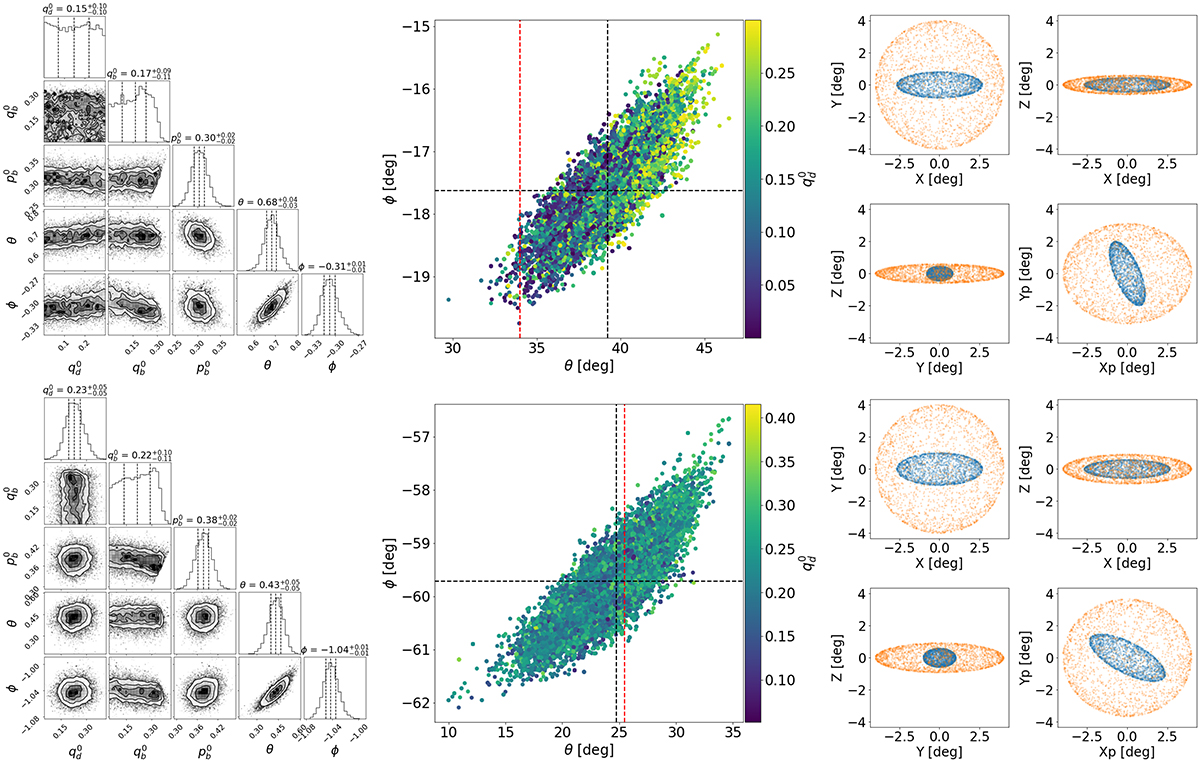
Fig. 14.
Download original image
LMC de-projection and viewing angles. Left panels: The corner plots show the MCMC distributions of the viable intrinsic axis ratios of the axisymmetric disc (qd0), the triaxial bar (qb0, pb0), and the viewing angles θ and ϕ in rad that result in the observed morphological decompositions of the LMC from the two cases shown in Fig. 12. Middle panels: Zoom-in of the (θ, ϕ) planes colour-coded by the disc intrinsic flattening. The dashed black lines show the median angles from the de-projection, while the red dashed line shows the best-fit inclination angle (θ) from the 2D Jeans dynamical model in the top panel and the 3D Jeans model in the bottom panel. Right panels: Embedded ellipsoids of the de-projected disc and bar with axis ratios as inferred from the de-projection of the LMC morphological decomposition from Fig. 12 and viewed from the three cardinal directions and from viewing angles θ and ϕ.
Current usage metrics show cumulative count of Article Views (full-text article views including HTML views, PDF and ePub downloads, according to the available data) and Abstracts Views on Vision4Press platform.
Data correspond to usage on the plateform after 2015. The current usage metrics is available 48-96 hours after online publication and is updated daily on week days.
Initial download of the metrics may take a while.