Fig. 12.
Download original image
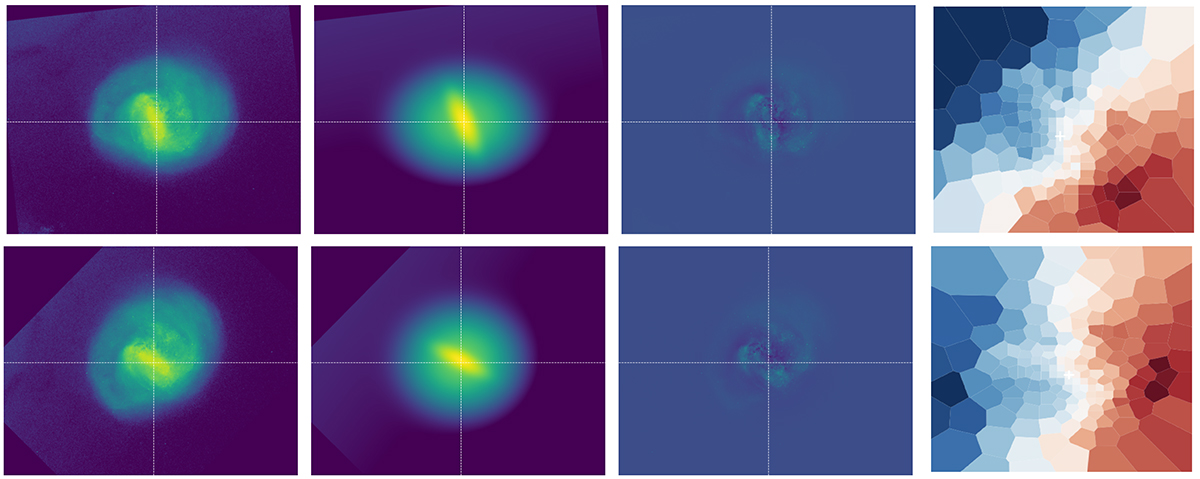
LMC disc – bar decomposition. From left to right: Gaia DR3 density map of the LMC, the best-fit GALFIT model, the GALFIT model residuals, and the Gaia DR3 LOS Voronoi map in the same orientation. The white dashed lines denote the best-fit major and minor photometric axes that cross at the best-fit photometric centre according to the GALFIT solution. The top row is the best-fit solution when all GALFIT parameters are left free; the bottom row shows the GALFIT solution when the orientation of the large photometric axis and projected flattening are set to the orientation of the line of nodes and projected flattening according to the 3D Jeans model and using the adopted Sérsic indices of the disc and bar nd = nb = 0.5.
Current usage metrics show cumulative count of Article Views (full-text article views including HTML views, PDF and ePub downloads, according to the available data) and Abstracts Views on Vision4Press platform.
Data correspond to usage on the plateform after 2015. The current usage metrics is available 48-96 hours after online publication and is updated daily on week days.
Initial download of the metrics may take a while.