Fig. 11.
Download original image
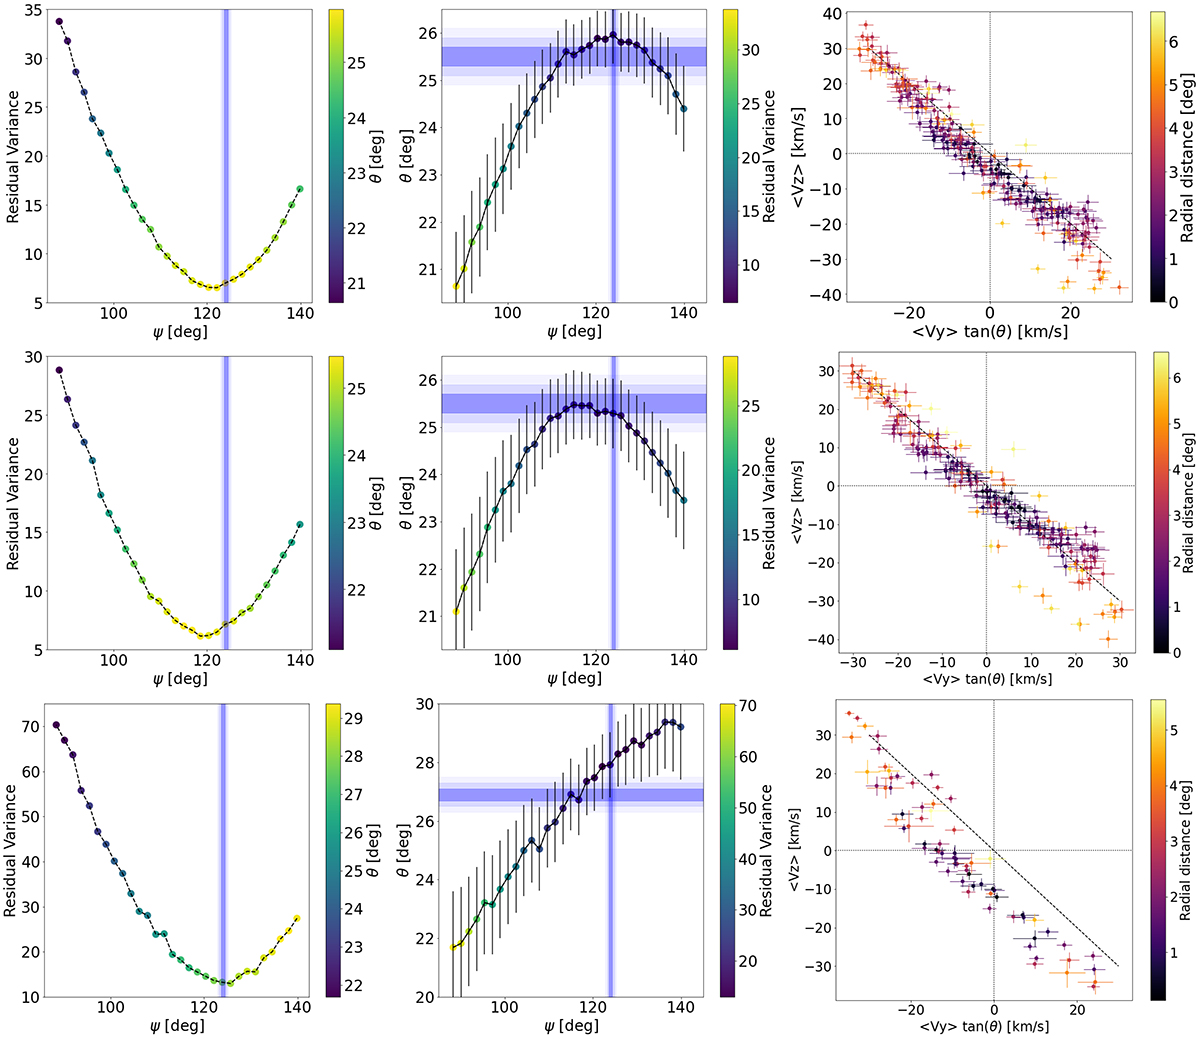
LMC axisymmetry tests. Left panels: Residual variance of the mean VLOS versus the mean VY correlation for different line of nodes orientations, colour-coded by the inclination angle for all stars (top), old stars (middle), and young stars (bottom) rows, respectively. Middle panels: Line of nodes orientation versus inclination angle, colour-coded by the residual variance for the old stars and separated into old and young populations. The shaded regions in these panels correspond to the best fit values from the 3D Jeans model and their uncertainties. Right panels: Mean VLOS versus mean VYtan(θ) for the LMC orientation with minimum residual variance for each respective population. These plots are colour-coded by distance from the centre of each Voronoi bin, and the dashed lines indicate a perfect anti-correlation.
Current usage metrics show cumulative count of Article Views (full-text article views including HTML views, PDF and ePub downloads, according to the available data) and Abstracts Views on Vision4Press platform.
Data correspond to usage on the plateform after 2015. The current usage metrics is available 48-96 hours after online publication and is updated daily on week days.
Initial download of the metrics may take a while.