Open Access
Fig. 9
Download original image
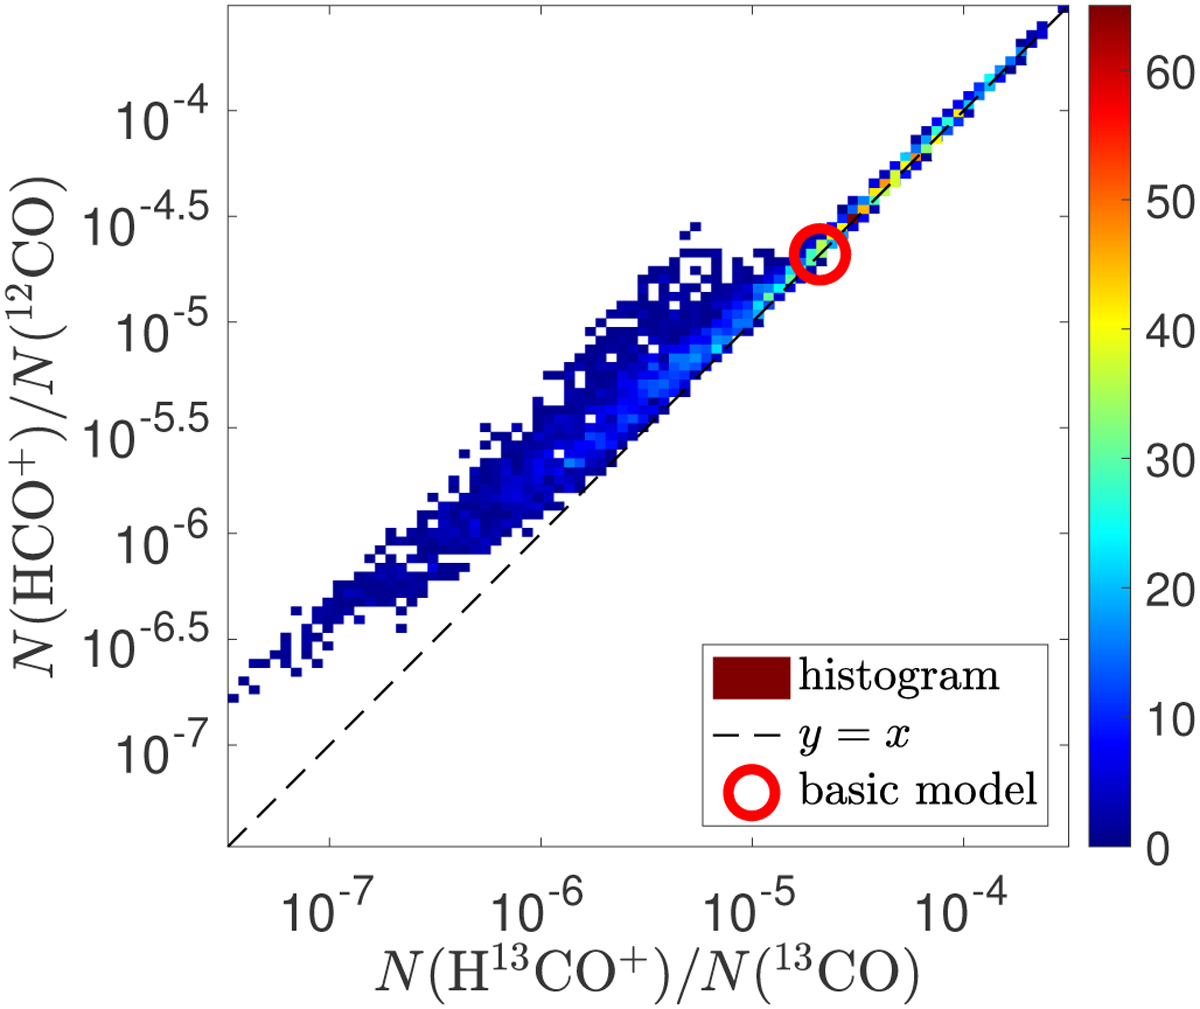
Joint histogram of N(HCO+)/N(12CO) versus N(H13CO+)/N(13CO) in log space for the 3224 chemical models sampling various physical conditions in translucent gas. The red circle shows the ratio derived from the basic abundances listed in Eq. (24). The dashed blue line has a slope of 1.0.
Current usage metrics show cumulative count of Article Views (full-text article views including HTML views, PDF and ePub downloads, according to the available data) and Abstracts Views on Vision4Press platform.
Data correspond to usage on the plateform after 2015. The current usage metrics is available 48-96 hours after online publication and is updated daily on week days.
Initial download of the metrics may take a while.