Fig. 8
Download original image
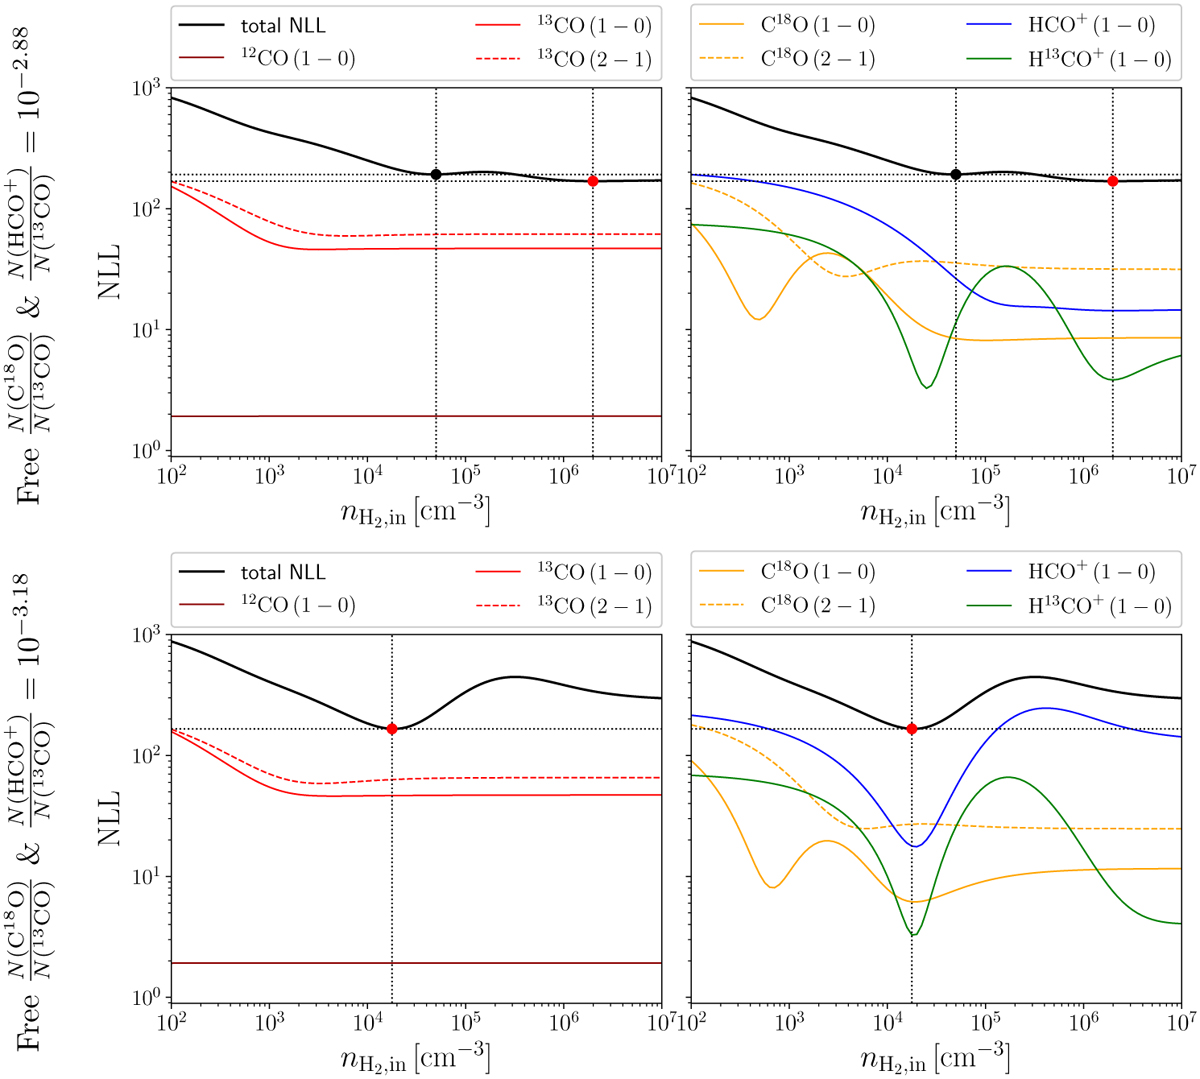
Comparison of the variations of the NLL as a function of the volume density of the inner layer for the LoS A. We used a sandwich model where N(13CO) and N (C18 O) were fitted, while the column densities of 12CO, HCO+, and H13CO+ were computed assuming fixed abundances relative to 13CO. The top and bottom rows show the NLL variations for two values of N(HCO+)/N(13CO) varying by a factor of 2.0. The left panel shows the NLL variations for the 12CO and 13CO lines, while the right panel show that of the C18O, HCO+, and H13CO+ lines. In both panels, the black plain lines shows the variations of the NLL when fitting all the lines. The top row shows two local minima at similar NLL values while the bottom row only shows one local minimum. The vertical and horizontal black dotted lines intersect at the lowest NLL value, indicated by the red circle, and at the second local minimum that is indicated by the black circle, when it exists.
Current usage metrics show cumulative count of Article Views (full-text article views including HTML views, PDF and ePub downloads, according to the available data) and Abstracts Views on Vision4Press platform.
Data correspond to usage on the plateform after 2015. The current usage metrics is available 48-96 hours after online publication and is updated daily on week days.
Initial download of the metrics may take a while.