Fig. 6
Download original image
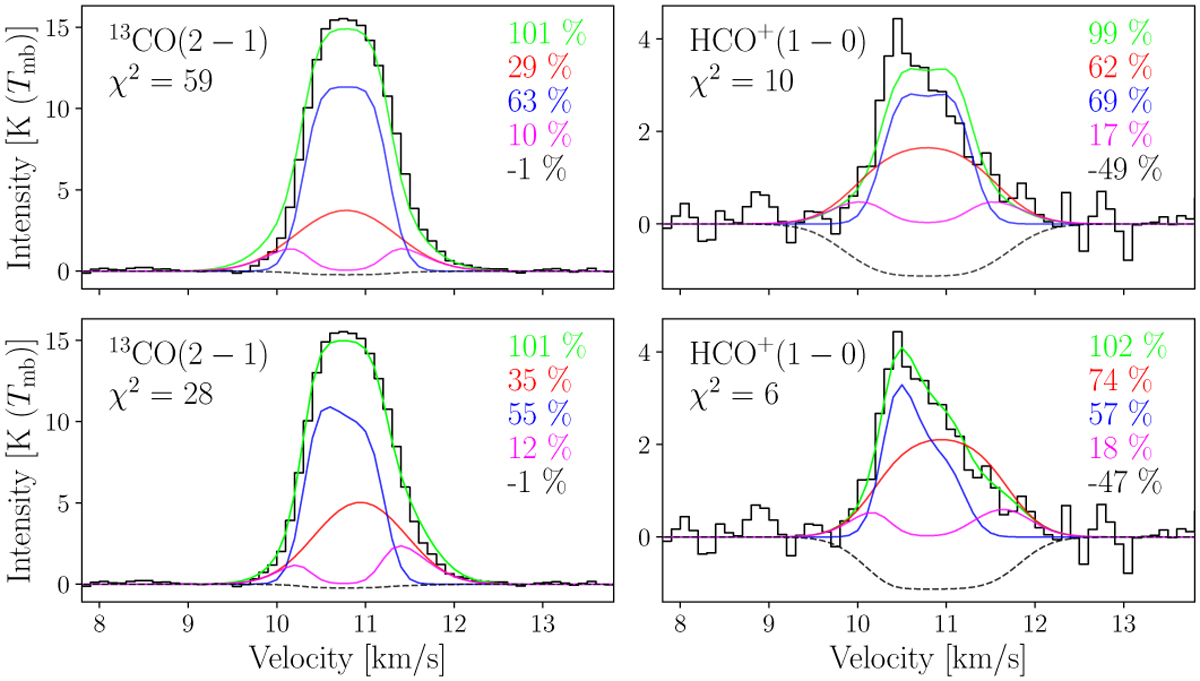
Comparison of the data and the fit of the sandwich model when either the centroid velocities of all layers are assumed to be identical (top row) or they can have different values in the inner and outer layers (bottom row). The left and right columns show this comparison for the 13CO (2 − 1) and HCO+ (1 − 0) lines, respectively. These spectra correspond to the LoS B (see Table 2). Data and fitted spectra are shown in black and green lines, respectively. The contributions of the different layers are shown as colored lines: red for the foreground layer (see Eq. (9)), blue for the inner layer (see Eq. (10)), pink for the background layer (see Eq. (11)), and dashed black for the CMB (see Eq. (12)).
Current usage metrics show cumulative count of Article Views (full-text article views including HTML views, PDF and ePub downloads, according to the available data) and Abstracts Views on Vision4Press platform.
Data correspond to usage on the plateform after 2015. The current usage metrics is available 48-96 hours after online publication and is updated daily on week days.
Initial download of the metrics may take a while.