Fig. 5
Download original image
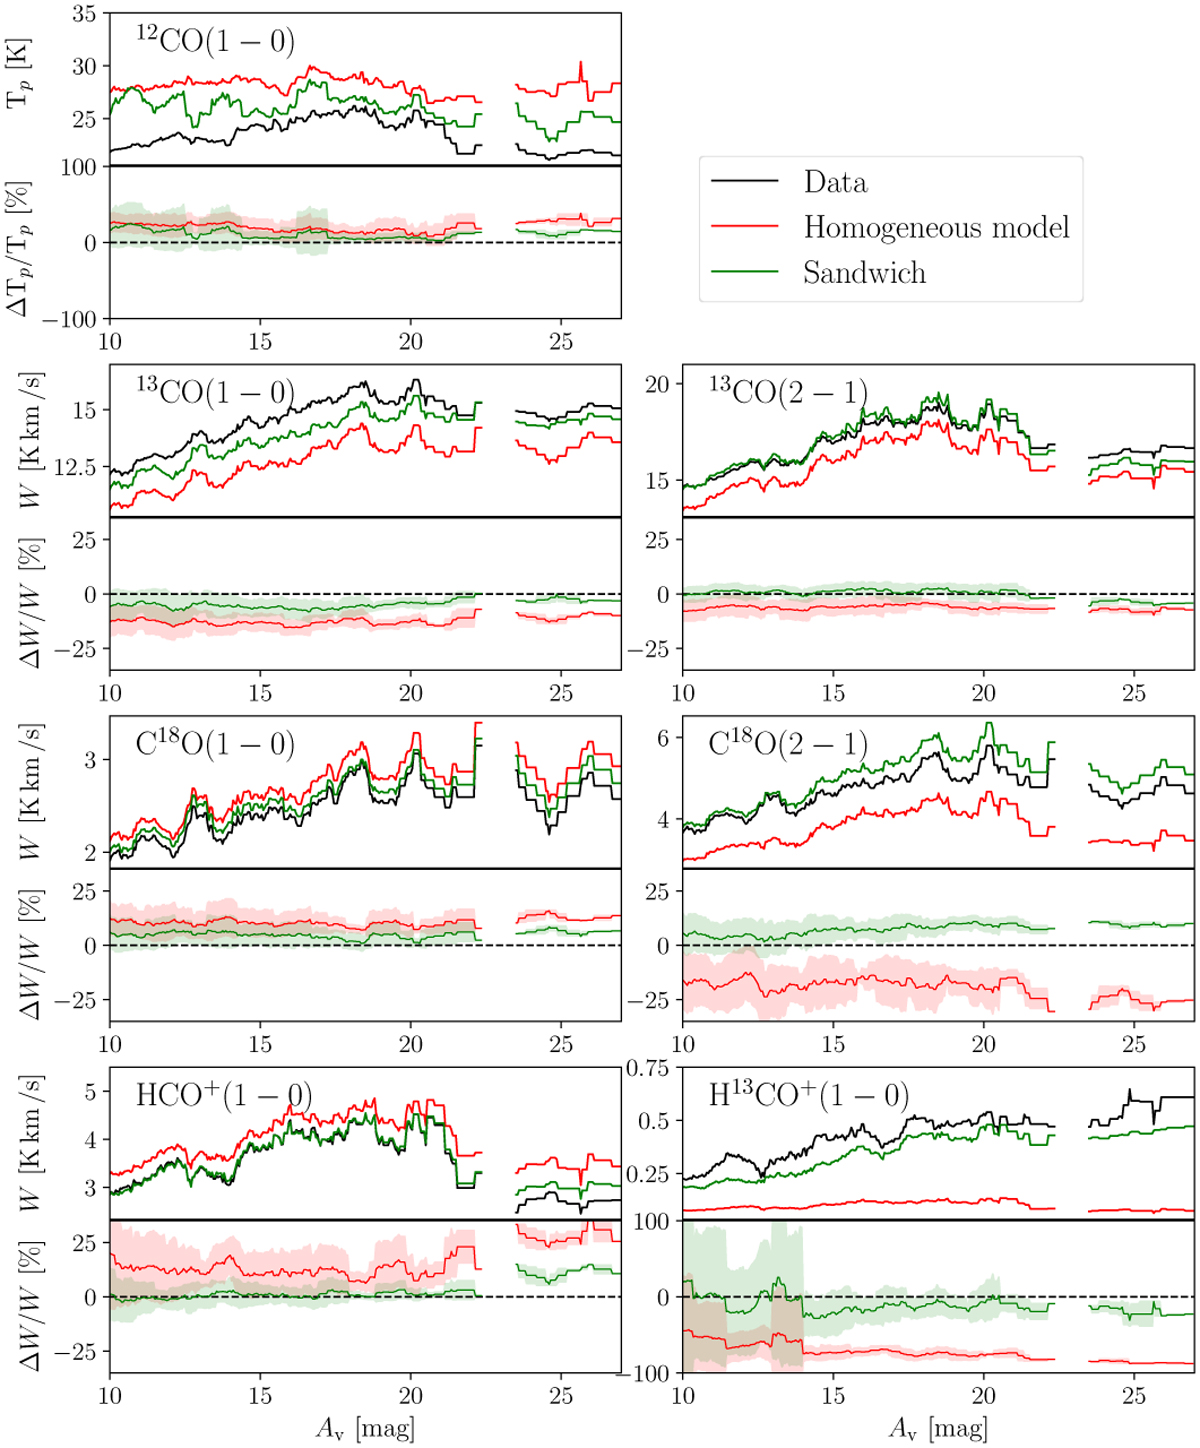
Comparison of the reconstruction of all integrated line intensities for the best fit obtained with either a homogeneous (in red) or a simple sandwich model (in green). The integrated line intensity or peak temperature are plotted as a function of the visual extinction (AV). More precisely, the integrated line intensities (zero-order moment) or peak temperature are averaged over all the pixels whose visual extinction belongs to the [AV − 0.5, AV + 0.5] mag interval, where AV is plotted on the x-axis of the panels. The lack of values for AV ∈ [23, 24] mag results from the fact that there is no pixel in this range of AV over the studied field of view. In each panel, the top one shows the line integrated intensity or peak intensity, while the bottom one shows the reconstruction relative error in percentage. The colored areas on the relative error panels show the standard deviation over all the pixels that belong to the 1 mag-AV sliding window. The horizontal dashed line indicates a perfect reconstruction. While the simple sandwich model already better fit the data than the homogeneous model, the reconstruction will still be improved by refining the assumptions.
Current usage metrics show cumulative count of Article Views (full-text article views including HTML views, PDF and ePub downloads, according to the available data) and Abstracts Views on Vision4Press platform.
Data correspond to usage on the plateform after 2015. The current usage metrics is available 48-96 hours after online publication and is updated daily on week days.
Initial download of the metrics may take a while.