Fig. 3
Download original image
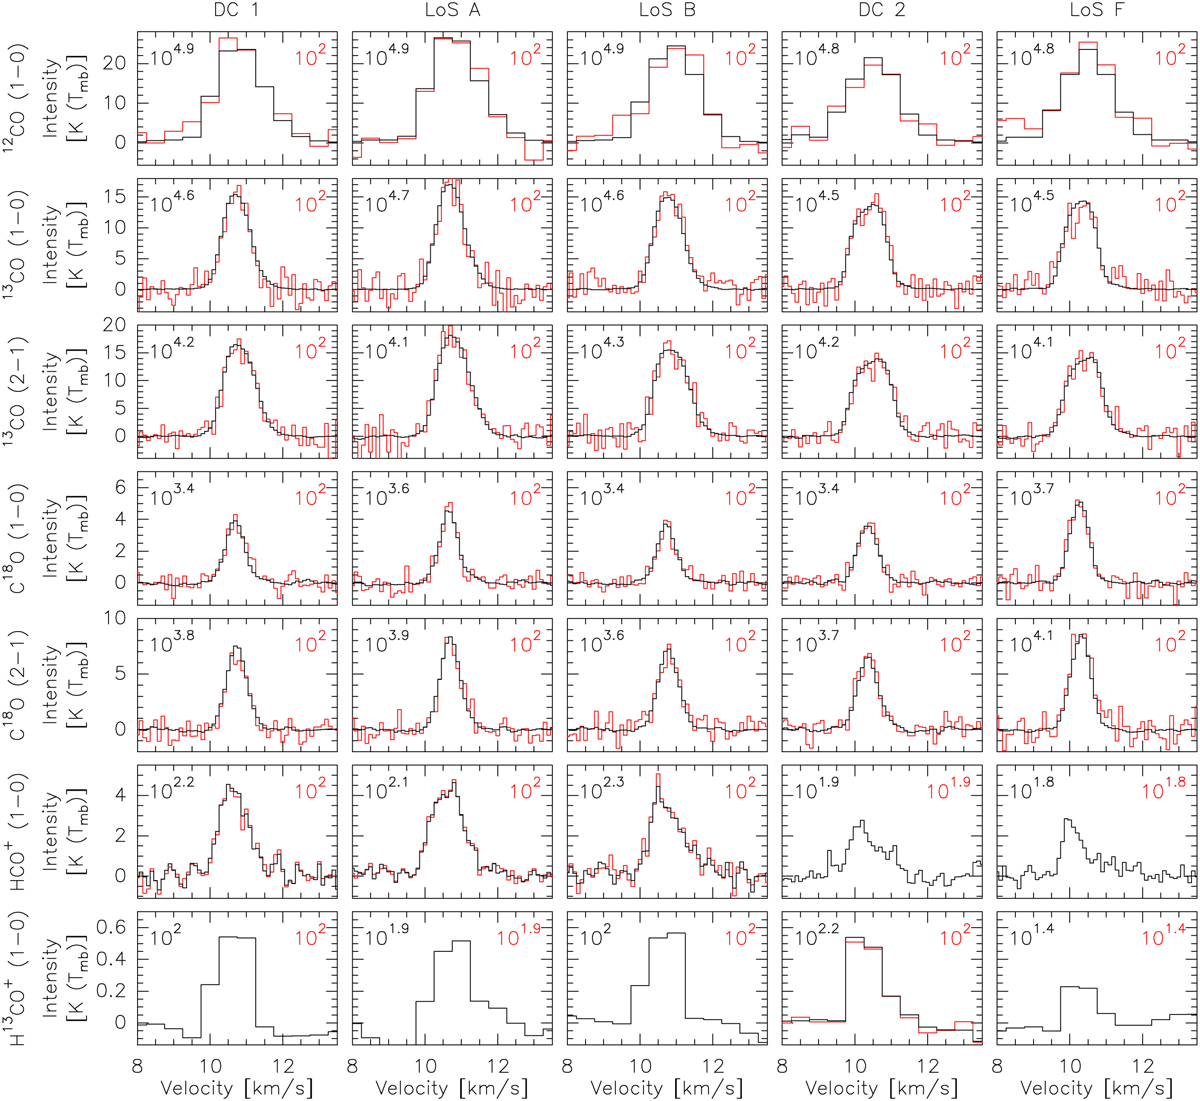
Comparison of five observed spectra (black histograms) and the same ones plus the required amount of noise to saturate their peak S/N to ten (red histograms). The positions of the spectra are marked on Fig. 1 and listed in Table 2. Each row corresponds to a given species and transition, while each column corresponds to a given position. In each panel, the top left and right numbers give the relative weight of a difference of 1 K in any given channel on the fit χ2 value before and after the S/N saturation, respectively. The 12CO (1 − 0) and H13CO+ (1 − 0) lines were observed with a resolution about 5 times coarser than the other lines. When the peak S/N is lower than 10, the red spectrum is hidden under the black one.
Current usage metrics show cumulative count of Article Views (full-text article views including HTML views, PDF and ePub downloads, according to the available data) and Abstracts Views on Vision4Press platform.
Data correspond to usage on the plateform after 2015. The current usage metrics is available 48-96 hours after online publication and is updated daily on week days.
Initial download of the metrics may take a while.