Open Access
Fig. H.3
Download original image
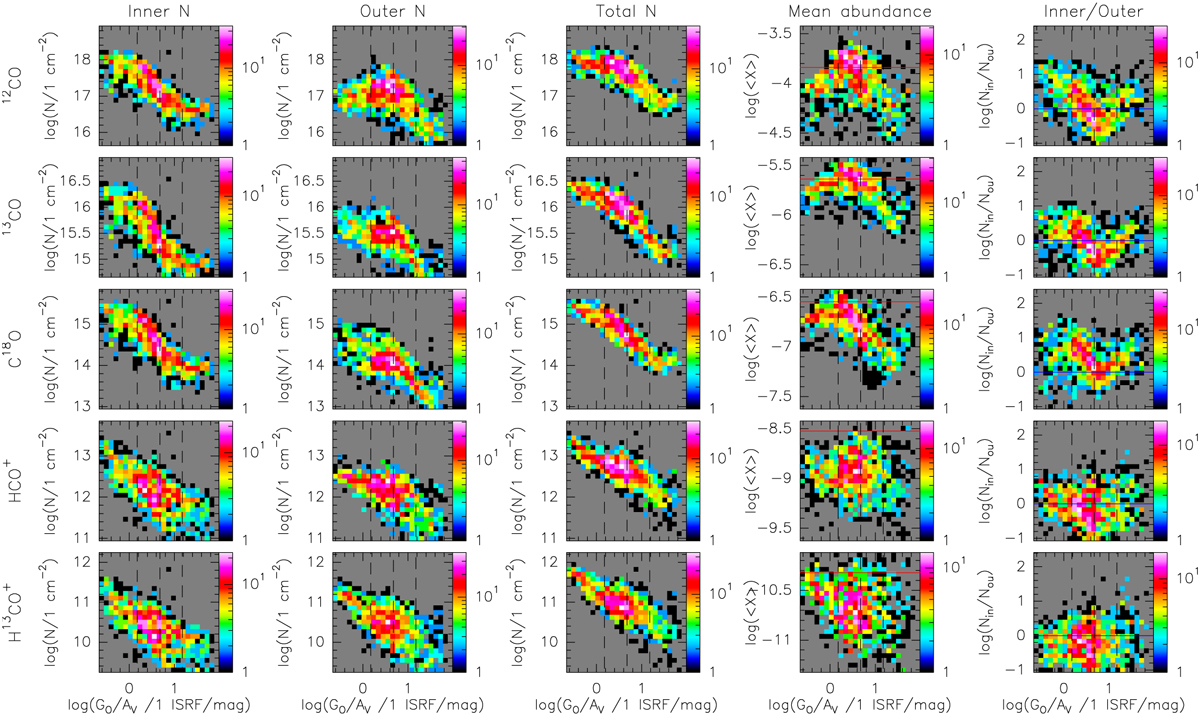
Joint histograms of the column densities, their abundances, or their ratios as a function of the visual extinction for the studied species. The dashed vertical lines mark the G0/AV values at 1.5, 4.75, and 15 ISRF/ mag. The remainder of the figure layout is identical to Fig. 14.
Current usage metrics show cumulative count of Article Views (full-text article views including HTML views, PDF and ePub downloads, according to the available data) and Abstracts Views on Vision4Press platform.
Data correspond to usage on the plateform after 2015. The current usage metrics is available 48-96 hours after online publication and is updated daily on week days.
Initial download of the metrics may take a while.