Fig. 17
Download original image
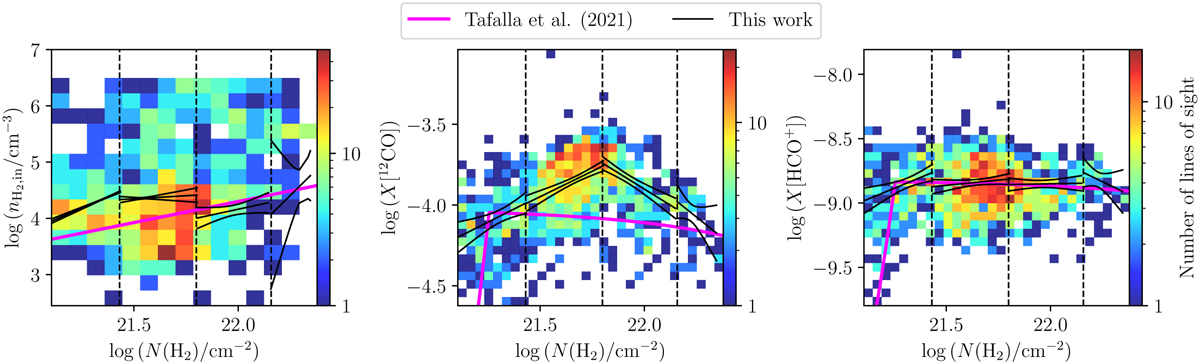
Comparison between the sandwich and TUH models. Left: volume density of the inner layer ![]() estimated with the sandwich model as a function of the H2 column density. Middle and right: comparison of the mean abundance estimated with the sandwich model as a function of the H2 column density and the model proposed by Tafalla et al. (2021). The second and third panels show this comparison for 12CO and HCO+, respectively. In all panels, joint histograms show our data. The black lines show the power law fits and their uncertainty intervals. The pink lines show the Tafalla et al.’s model. The dashed vertical lines mark the N(H2) corresponding to a visual extinction at 3, 7, and 16 mag.
estimated with the sandwich model as a function of the H2 column density. Middle and right: comparison of the mean abundance estimated with the sandwich model as a function of the H2 column density and the model proposed by Tafalla et al. (2021). The second and third panels show this comparison for 12CO and HCO+, respectively. In all panels, joint histograms show our data. The black lines show the power law fits and their uncertainty intervals. The pink lines show the Tafalla et al.’s model. The dashed vertical lines mark the N(H2) corresponding to a visual extinction at 3, 7, and 16 mag.
Current usage metrics show cumulative count of Article Views (full-text article views including HTML views, PDF and ePub downloads, according to the available data) and Abstracts Views on Vision4Press platform.
Data correspond to usage on the plateform after 2015. The current usage metrics is available 48-96 hours after online publication and is updated daily on week days.
Initial download of the metrics may take a while.