Open Access
Fig. 16
Download original image
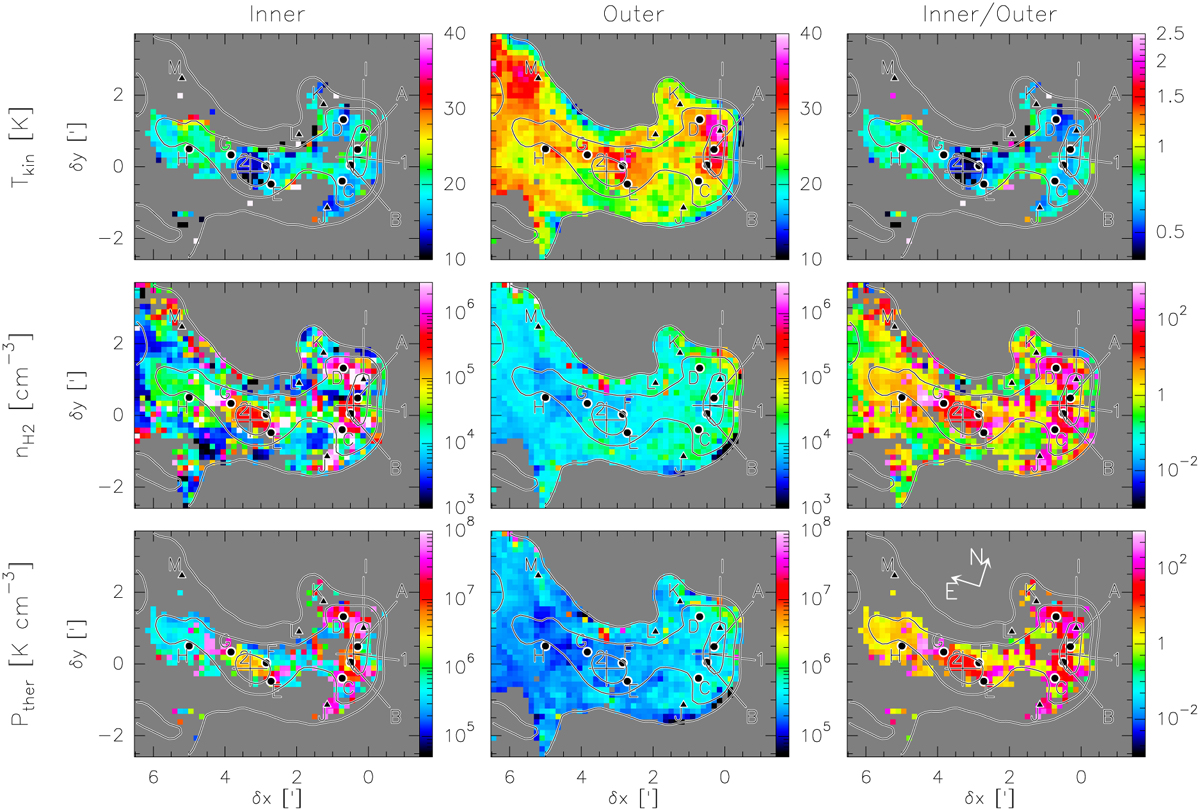
Maps of the gas physical conditions. From top to bottom: kinetic temperature, volume density, and thermal pressure. The first two columns display the values for the inner and outer (foreground or background) layers, while the last column shows their ratio.
Current usage metrics show cumulative count of Article Views (full-text article views including HTML views, PDF and ePub downloads, according to the available data) and Abstracts Views on Vision4Press platform.
Data correspond to usage on the plateform after 2015. The current usage metrics is available 48-96 hours after online publication and is updated daily on week days.
Initial download of the metrics may take a while.