Fig. 14
Download original image
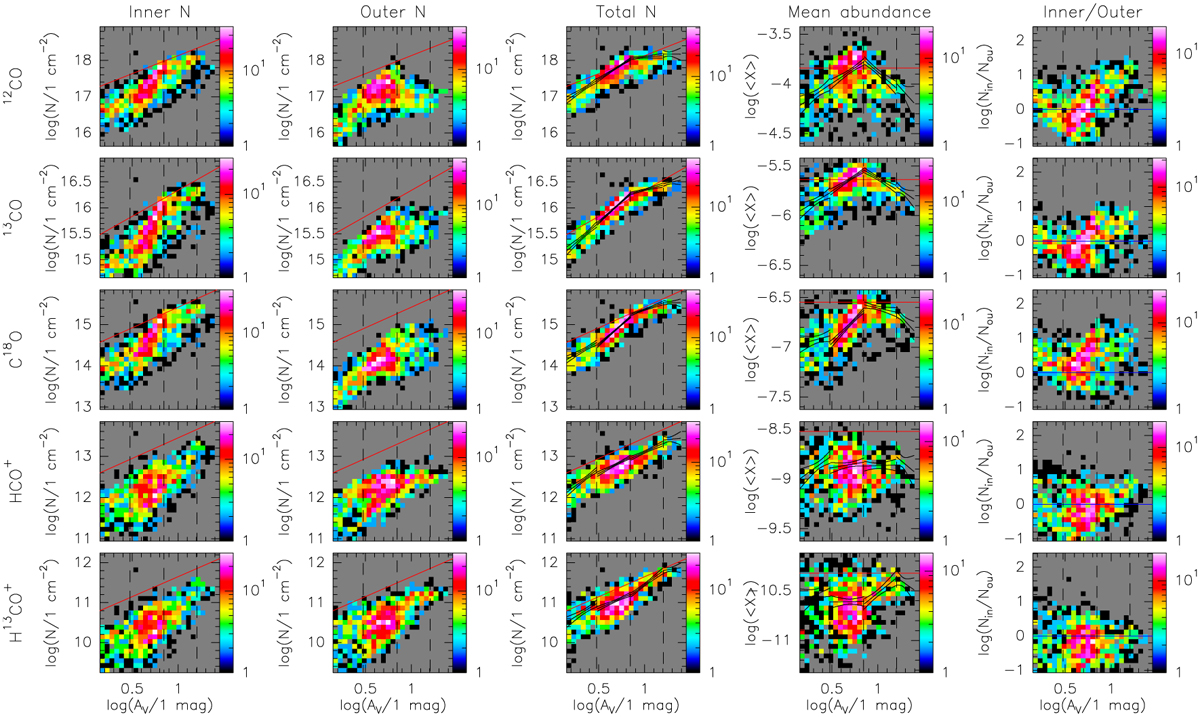
Joint histograms of the molecular column densities, abundances, or their ratios as a function of the visual extinction for 12CO, 13CO, C18O, HCO+, and H13CO+, from top to bottom. The three first columns show the column densities for the inner, outer (foreground or background), and total (inner plus twice outer) column densities, while the last column shows the mean abundance, namely, the total column density divided by the H2 column density deduced from the visual extinction. The dashed vertical lines mark the visual extinction at 3, 7, and 16 mag. The red plain lines show the species basic abundance. The black lines show the piecewise power-law fits of the column densities within the AV ranges specified above (see Table 6) and the ±3σ intervals of the fits. These fits can be directly converted to an abundance vs visual extinction relation.
Current usage metrics show cumulative count of Article Views (full-text article views including HTML views, PDF and ePub downloads, according to the available data) and Abstracts Views on Vision4Press platform.
Data correspond to usage on the plateform after 2015. The current usage metrics is available 48-96 hours after online publication and is updated daily on week days.
Initial download of the metrics may take a while.