Fig. 11
Download original image
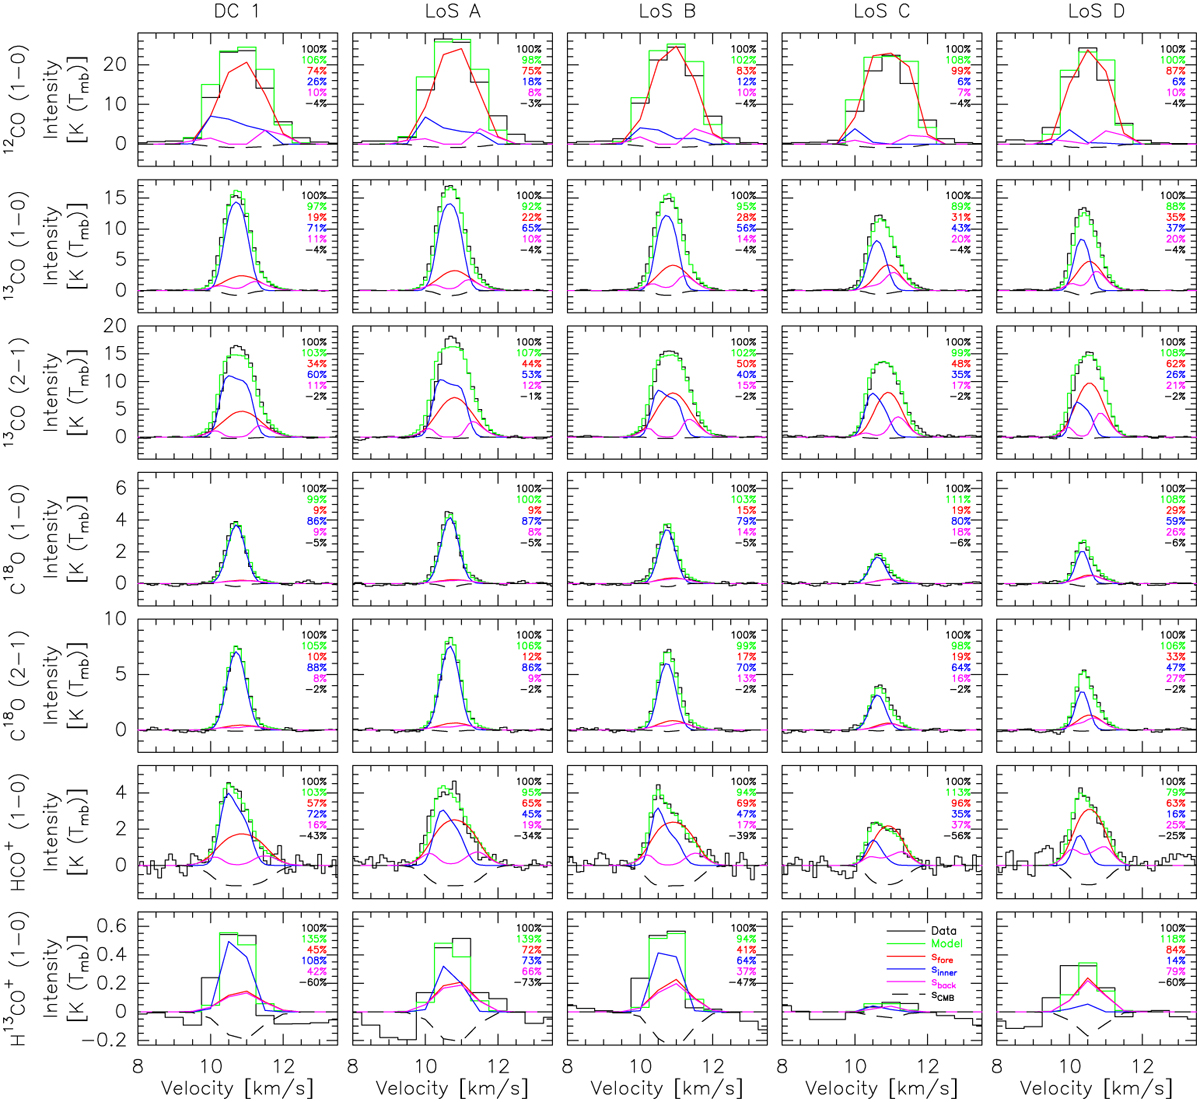
Modeled decomposition of some spectra around the first dense core. Each column corresponds to the spectra for one of the lines of sight listed in Table 2. Each row corresponds to a given line, from top to bottom: 12CO(1 − 0), 13CO(1 − 0) and (2 − 1), C18O(1 − 0) and (2 − 1), HCO+ (1 − 0), and H13CO+ (1 − 0). We show the decomposition of the full spectrum of 12CO (1 − 0) even though we only used its peak intensity during the fit. In each panel, the data and model spectra are shown as the black and green histograms, respectively. The contributions of the foreground, inner, background layers are shown as the plain lines in red, blue, pink, respectively, and the CMB layer is displayed as the dashed black line.
Current usage metrics show cumulative count of Article Views (full-text article views including HTML views, PDF and ePub downloads, according to the available data) and Abstracts Views on Vision4Press platform.
Data correspond to usage on the plateform after 2015. The current usage metrics is available 48-96 hours after online publication and is updated daily on week days.
Initial download of the metrics may take a while.