Fig. 10
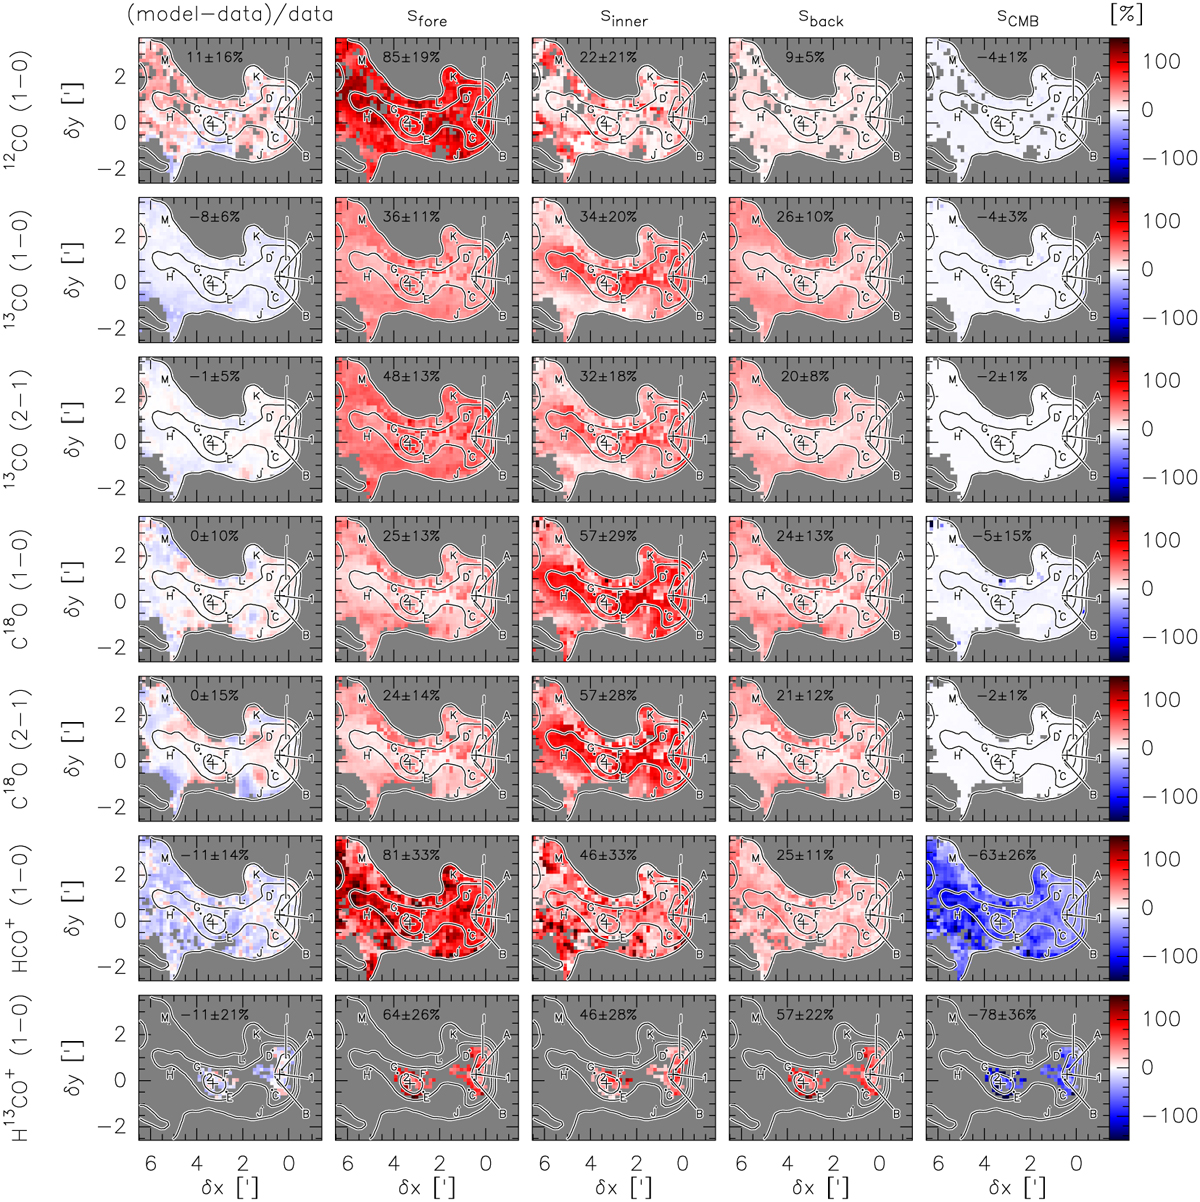
Download original image
Maps of the contributions of the different layers to the line intensity integrated between 8 and 13.5 km s−1. First column: relative error of the model with respect of the data in percentage. Second to fifth columns: contribution of the foreground, inner, background, and CMB layers to the line integrated intensity in percentage of that measured on the data. Each row corresponds to a given line: from top to bottom, 12CO (1 − 0), 13CO (1 − 0) and (2 − 1), C18O (1 − 0) and (2 − 1), HCO+ (1 − 0), and H13CO+ (1 − 0). The percentage on the top center of each panel is the mean±rms value computed over the associated maps. Positive and negative relative errors or contributions are shown in red and blue, respectively.
Current usage metrics show cumulative count of Article Views (full-text article views including HTML views, PDF and ePub downloads, according to the available data) and Abstracts Views on Vision4Press platform.
Data correspond to usage on the plateform after 2015. The current usage metrics is available 48-96 hours after online publication and is updated daily on week days.
Initial download of the metrics may take a while.