Open Access
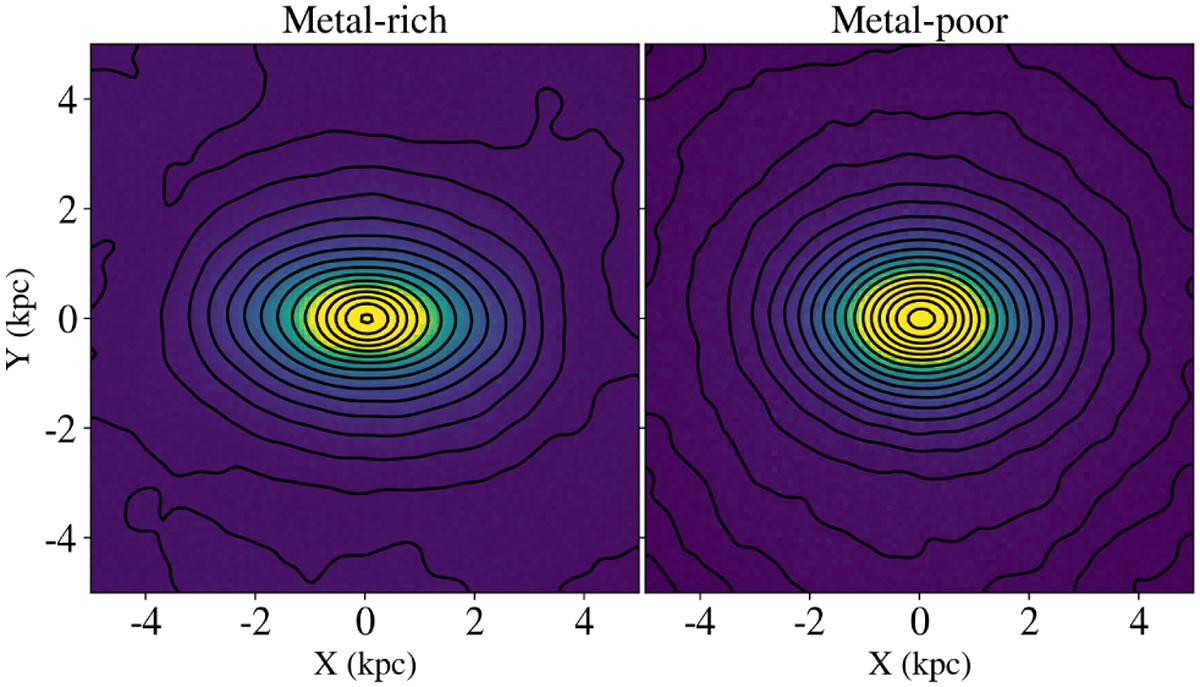
Fig. C.1
Download original image
Density maps for the metal-rich (left panel) and for the metal-poor (right panel) population, represented in a bar-aligned reference frame and normalised by the number of particles in each component (D1 and D3). Isodensity contours are added as solid lines.
Current usage metrics show cumulative count of Article Views (full-text article views including HTML views, PDF and ePub downloads, according to the available data) and Abstracts Views on Vision4Press platform.
Data correspond to usage on the plateform after 2015. The current usage metrics is available 48-96 hours after online publication and is updated daily on week days.
Initial download of the metrics may take a while.