Open Access
Fig. A.1
Download original image
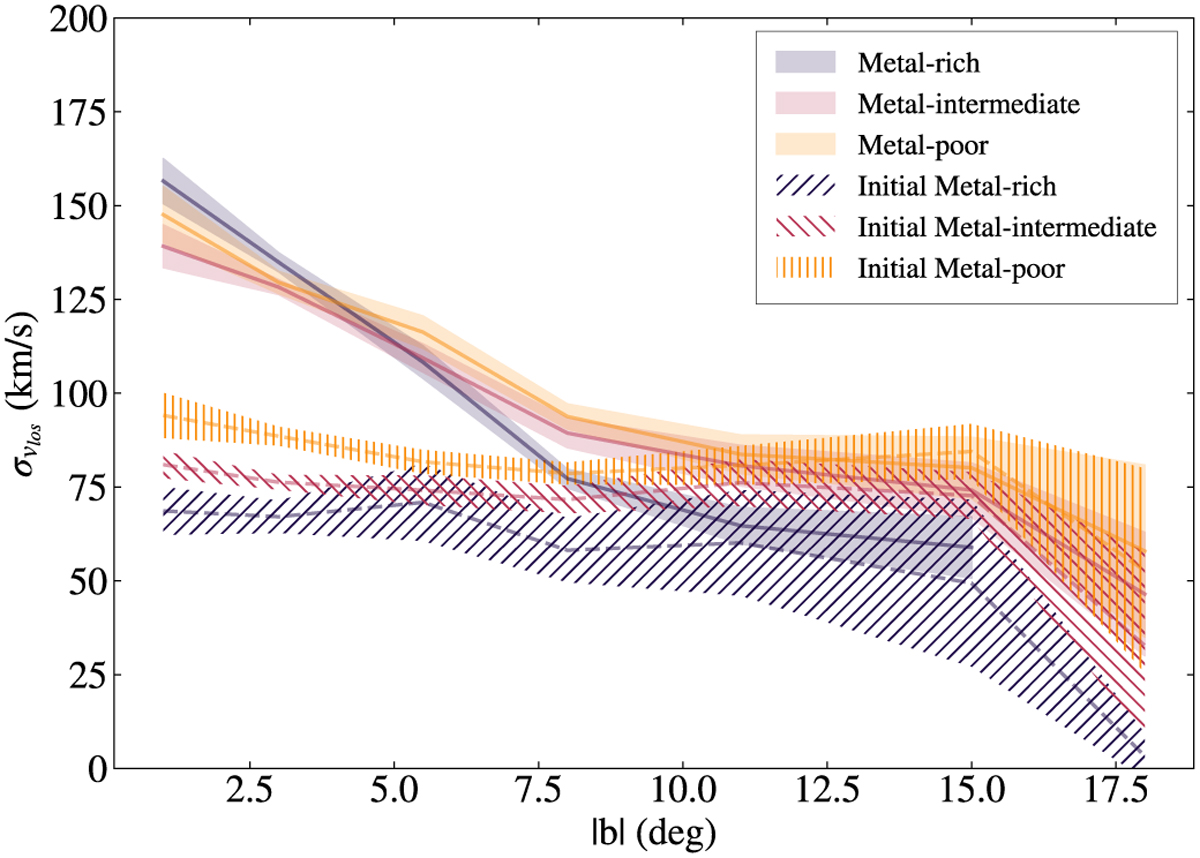
Line-of-sight velocity dispersion, ![]() , profiles of the three components in their initial condition (hatched areas and dotted lines) compared to the final profiles (filled areas and solid lines), with the same binning and colour coding used in Fig. 2. The profiles are plotted for stars with |ℓ|< 2° and |X| < 1.5kpc.
, profiles of the three components in their initial condition (hatched areas and dotted lines) compared to the final profiles (filled areas and solid lines), with the same binning and colour coding used in Fig. 2. The profiles are plotted for stars with |ℓ|< 2° and |X| < 1.5kpc.
Current usage metrics show cumulative count of Article Views (full-text article views including HTML views, PDF and ePub downloads, according to the available data) and Abstracts Views on Vision4Press platform.
Data correspond to usage on the plateform after 2015. The current usage metrics is available 48-96 hours after online publication and is updated daily on week days.
Initial download of the metrics may take a while.