Fig. 4
Download original image
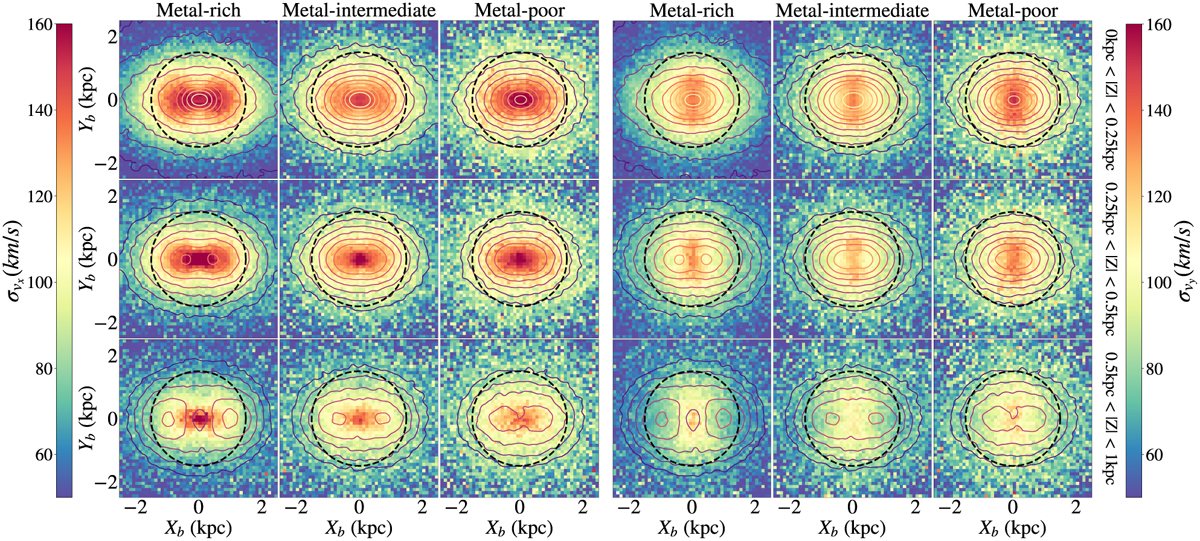
Maps of the velocity dispersion maps for the bar-oriented ![]() (left panel) and
(left panel) and ![]() (right panel) components. Each population (metal-rich, metal-intermediate, and metal-poor) correspond to a column in each panel, and different height cuts are represented on each row (0 kpc <|Z| < 0.25 kpc, 0.25 kpc <|Z| < 0.5 kpc, and 0.5 kpc <|Z| < 1 kpc). The axes are bar-oriented, isodensity contours are shown as coloured lines, and a 1.5 kpc region around the GC is shown as a dotted black circle.
(right panel) components. Each population (metal-rich, metal-intermediate, and metal-poor) correspond to a column in each panel, and different height cuts are represented on each row (0 kpc <|Z| < 0.25 kpc, 0.25 kpc <|Z| < 0.5 kpc, and 0.5 kpc <|Z| < 1 kpc). The axes are bar-oriented, isodensity contours are shown as coloured lines, and a 1.5 kpc region around the GC is shown as a dotted black circle.
Current usage metrics show cumulative count of Article Views (full-text article views including HTML views, PDF and ePub downloads, according to the available data) and Abstracts Views on Vision4Press platform.
Data correspond to usage on the plateform after 2015. The current usage metrics is available 48-96 hours after online publication and is updated daily on week days.
Initial download of the metrics may take a while.