Fig. 3
Download original image
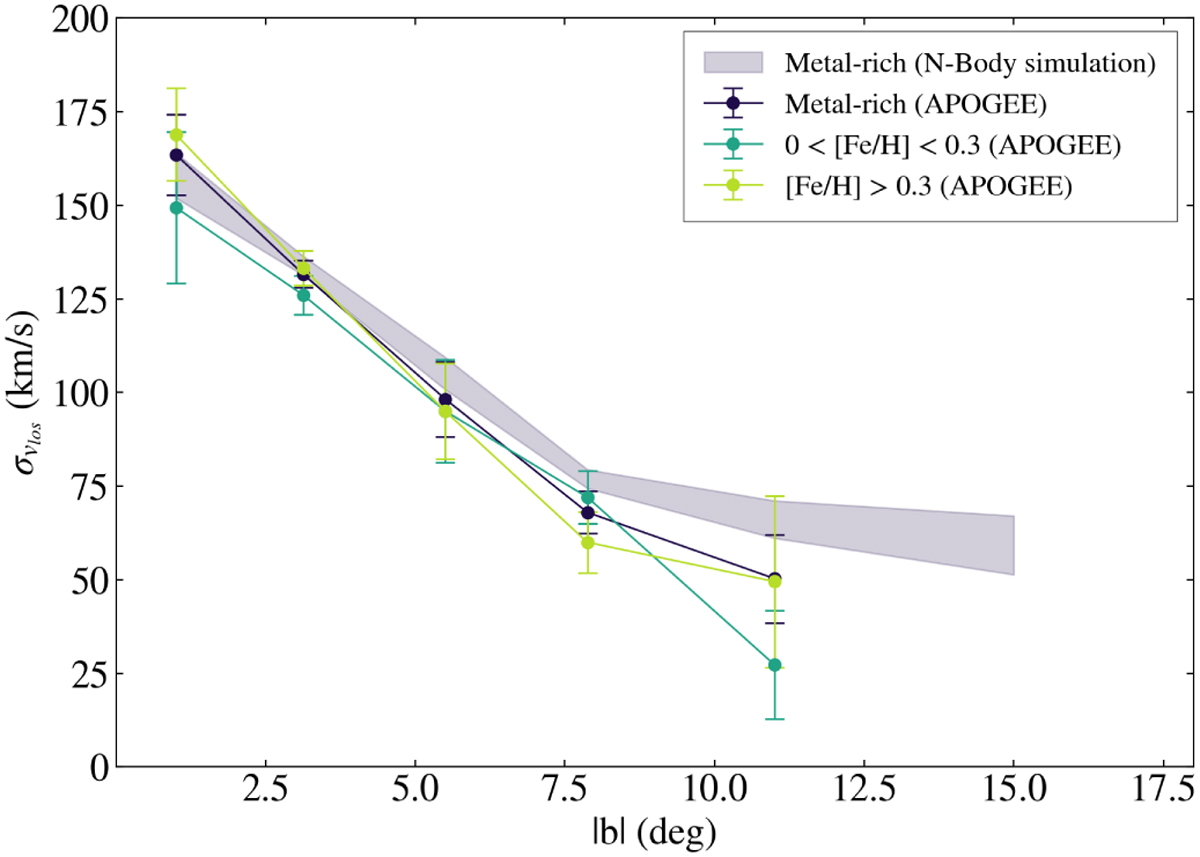
![]() line-of-sight velocity dispersion profiles of our quality APOGEE sample (error bar curves) and of our mock catalogue (shaded areas of height ±σ). The profiles are plotted for stars with |X| < 1.5 kpc and |ℓ|< 2°, for metal-rich stars ([Fe/H] > 0), and two metal-rich populations defined as very metal-rich (0 < [Fe/H] ≤ 0.3) and extremely metal-rich ([Fe/H] > 0.3).
line-of-sight velocity dispersion profiles of our quality APOGEE sample (error bar curves) and of our mock catalogue (shaded areas of height ±σ). The profiles are plotted for stars with |X| < 1.5 kpc and |ℓ|< 2°, for metal-rich stars ([Fe/H] > 0), and two metal-rich populations defined as very metal-rich (0 < [Fe/H] ≤ 0.3) and extremely metal-rich ([Fe/H] > 0.3).
Current usage metrics show cumulative count of Article Views (full-text article views including HTML views, PDF and ePub downloads, according to the available data) and Abstracts Views on Vision4Press platform.
Data correspond to usage on the plateform after 2015. The current usage metrics is available 48-96 hours after online publication and is updated daily on week days.
Initial download of the metrics may take a while.