Fig. 2
Download original image
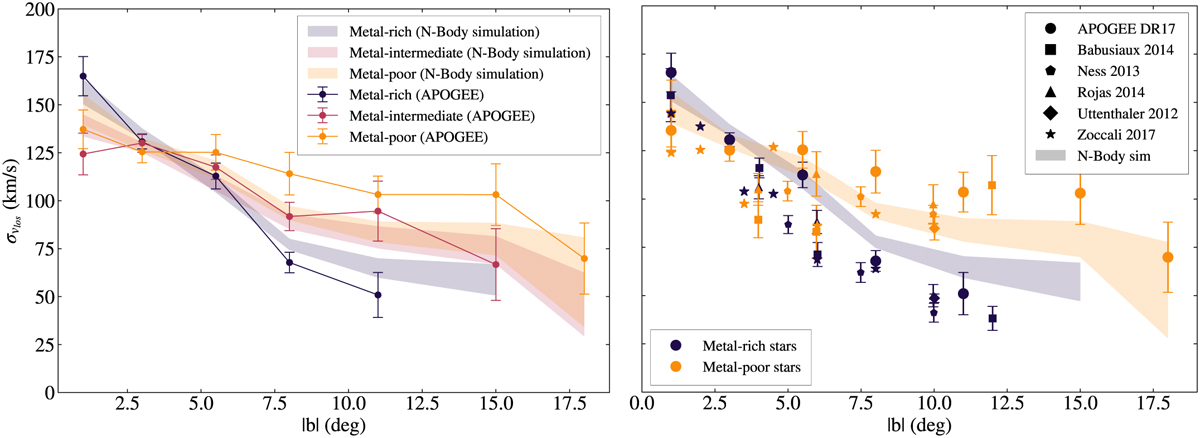
Line-of-sight velocity dispersion, ![]() , profiles. Left panel: our quality APOGEE sample (error bar curves) and our mock catalogue (shaded areas of height ±σ). The profiles are plotted for stars with |ℓ|< 2° and |X| < 1.5kpc. Right panel: profiles of our quality APOGEE sample (error bar with circle symbol) and of our mock catalogue (shaded areas of height ±σ), compared to results from Babusiaux et al. (2014) and Babusiaux et al. (2010) (squares), Ness et al. (2013b) (pentagons), Rojas-Arriagada et al. (2014) (triangles), Uttenthaler et al. (2012) (diamonds), and Zoccali et al. (2017) (stars).
, profiles. Left panel: our quality APOGEE sample (error bar curves) and our mock catalogue (shaded areas of height ±σ). The profiles are plotted for stars with |ℓ|< 2° and |X| < 1.5kpc. Right panel: profiles of our quality APOGEE sample (error bar with circle symbol) and of our mock catalogue (shaded areas of height ±σ), compared to results from Babusiaux et al. (2014) and Babusiaux et al. (2010) (squares), Ness et al. (2013b) (pentagons), Rojas-Arriagada et al. (2014) (triangles), Uttenthaler et al. (2012) (diamonds), and Zoccali et al. (2017) (stars).
Current usage metrics show cumulative count of Article Views (full-text article views including HTML views, PDF and ePub downloads, according to the available data) and Abstracts Views on Vision4Press platform.
Data correspond to usage on the plateform after 2015. The current usage metrics is available 48-96 hours after online publication and is updated daily on week days.
Initial download of the metrics may take a while.