Fig. 1
Download original image
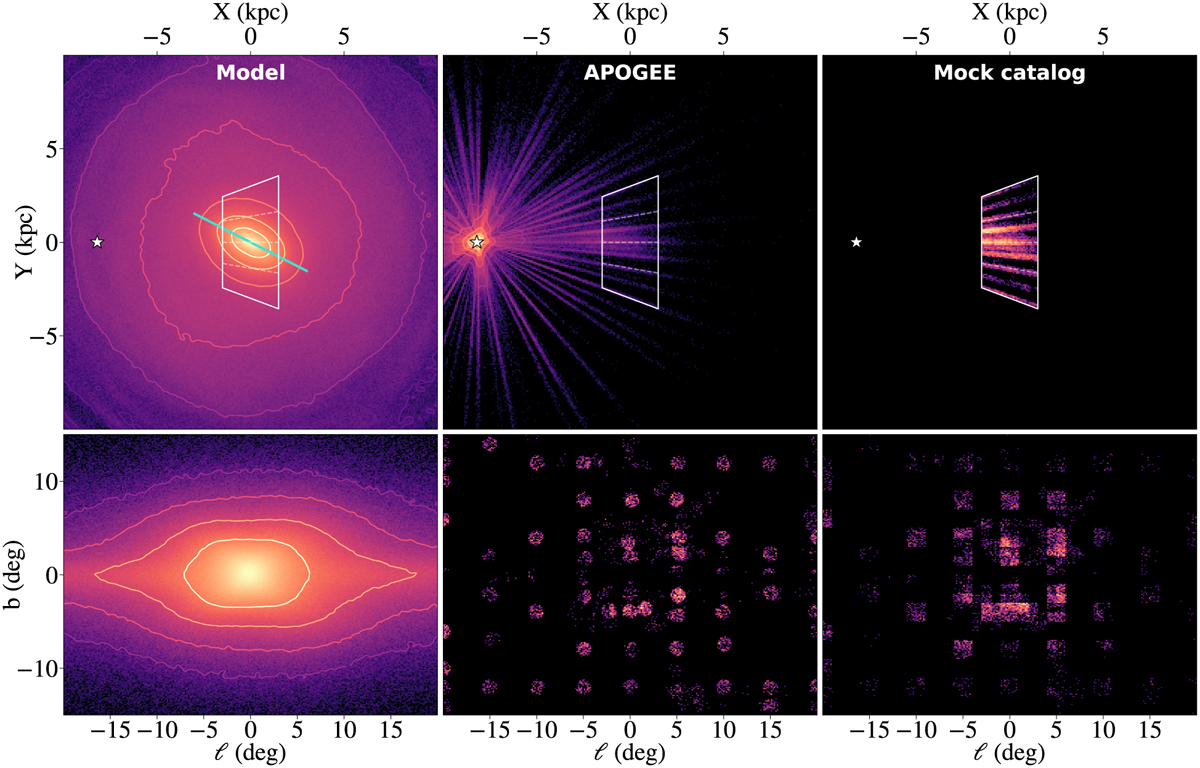
Density maps of the N-body simulation stars (left column), APOGEE stars (middle column), and our mock catalogue stars (right column). Top panel: face-on maps (X-Y-plane), with |X| < 1.5kpc distance bounds and ±20° longitude bounds in white, as well as a green line to guide the eye, indicating the angle of the Galactic bar and the Sun at X = −8.12 kpc,Y = 0 kpc (white star symbol). Bottom panels: corresponding maps in the Galactic (ℓ,b) plane. The colours indicate relative densities for each of the three catalogues separately.
Current usage metrics show cumulative count of Article Views (full-text article views including HTML views, PDF and ePub downloads, according to the available data) and Abstracts Views on Vision4Press platform.
Data correspond to usage on the plateform after 2015. The current usage metrics is available 48-96 hours after online publication and is updated daily on week days.
Initial download of the metrics may take a while.