Fig. 9
Download original image
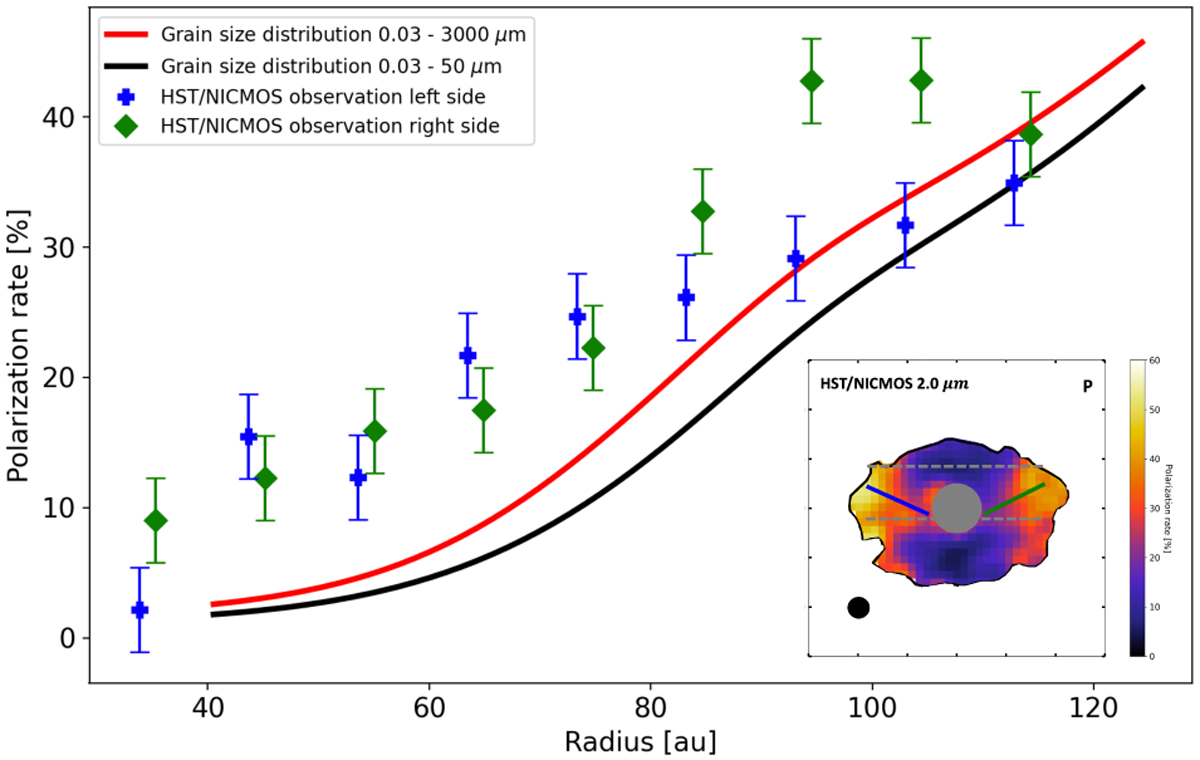
Observed (data points) and model (curves) polarization fraction measured along the top disk surface from the edge of the coronagraphic mask to the outer edge of the disk. The red and black model curves only differ by the maximum grain size, with amax = 3000 and 50 µm, respectively. The inset presents the same image as in Fig. 4, and the solid blue and green lines correspond to the radius along which the polarization rate is measured. The limits between the average pixel values are represented by the two dashed gray lines.
Current usage metrics show cumulative count of Article Views (full-text article views including HTML views, PDF and ePub downloads, according to the available data) and Abstracts Views on Vision4Press platform.
Data correspond to usage on the plateform after 2015. The current usage metrics is available 48-96 hours after online publication and is updated daily on week days.
Initial download of the metrics may take a while.