Fig. 8
Download original image
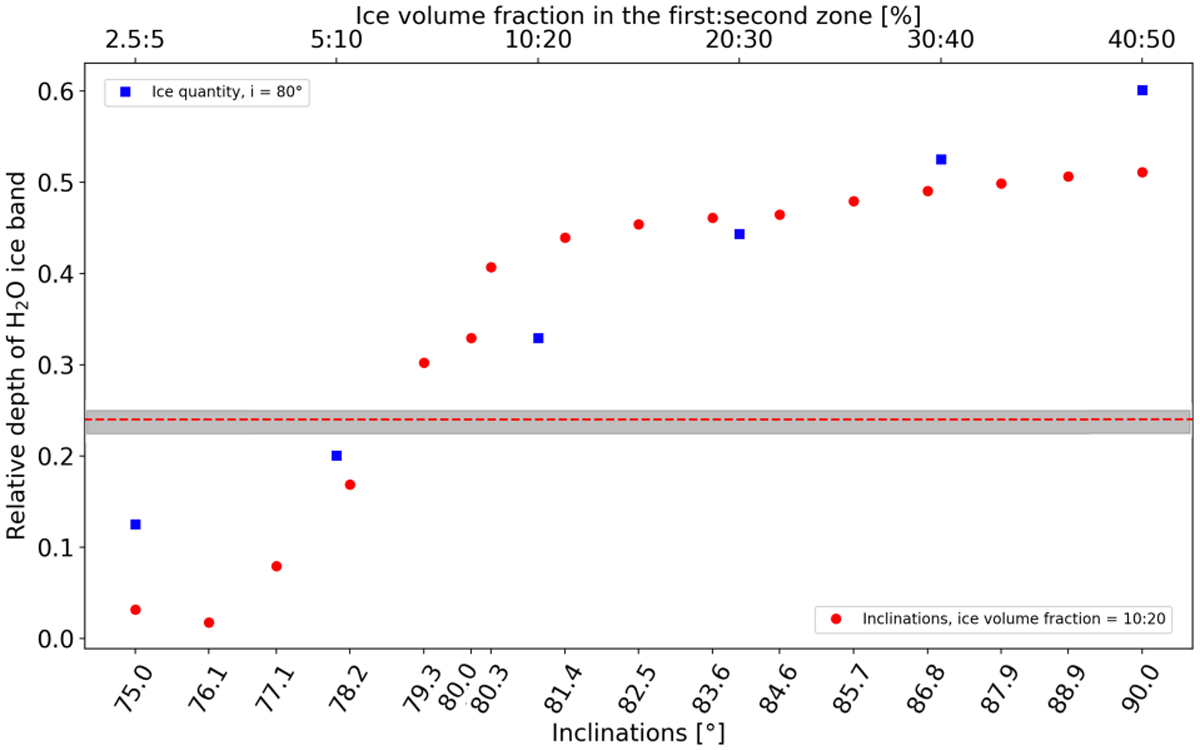
Variations in the relative depth of the water-ice band as a function of the system inclination and the ice quantity. All model parameters remain unchanged, except for the inclination for the red dots and ice quantities for the blue dots. The horizontal dashed red line indicates the measured band depth (Terada & Tokunaga 2017).
Current usage metrics show cumulative count of Article Views (full-text article views including HTML views, PDF and ePub downloads, according to the available data) and Abstracts Views on Vision4Press platform.
Data correspond to usage on the plateform after 2015. The current usage metrics is available 48-96 hours after online publication and is updated daily on week days.
Initial download of the metrics may take a while.