Fig. 4
Download original image
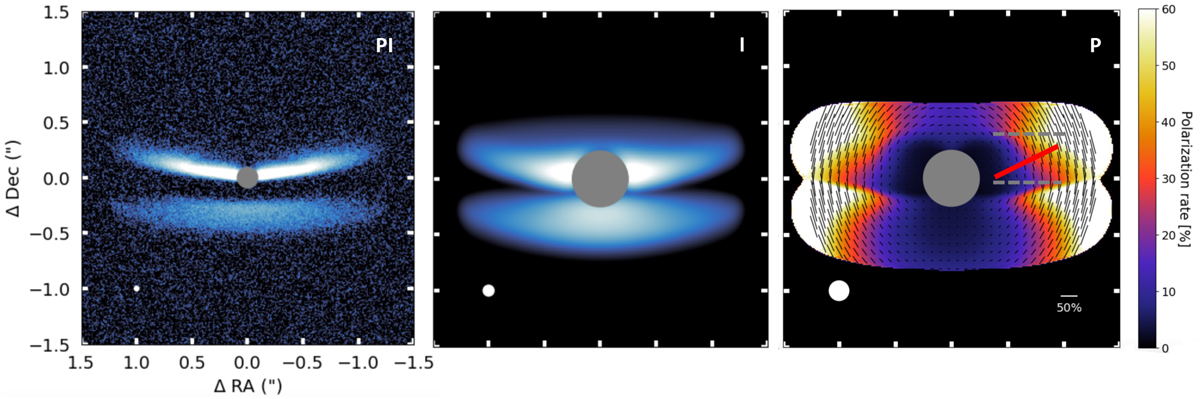
Synthetic observations of our best PDS 453 model with two zones, with similar scales and stretches as in Fig. 1. All images have been convolved by the appropriate PSF after we subtracted the central point source to mimic the effect of the coronagraph. Left panel: scattered-light 1.6 µm polarized intensity image shown at the SPHERE resolution. Middle panel: scattered-light F110W total intensity image at the NICMOS resolution. Right panel: scattered-light 2 µm polarized fraction map. The polarization vectors are superimposed. The solid red line approximates the location of the spine of the top nebula. The two gray lines represent the vertical range over which the total and polarized intensities are measured to compute the polarized fraction shown in Fig. 9.
Current usage metrics show cumulative count of Article Views (full-text article views including HTML views, PDF and ePub downloads, according to the available data) and Abstracts Views on Vision4Press platform.
Data correspond to usage on the plateform after 2015. The current usage metrics is available 48-96 hours after online publication and is updated daily on week days.
Initial download of the metrics may take a while.