Fig. A.1
Download original image
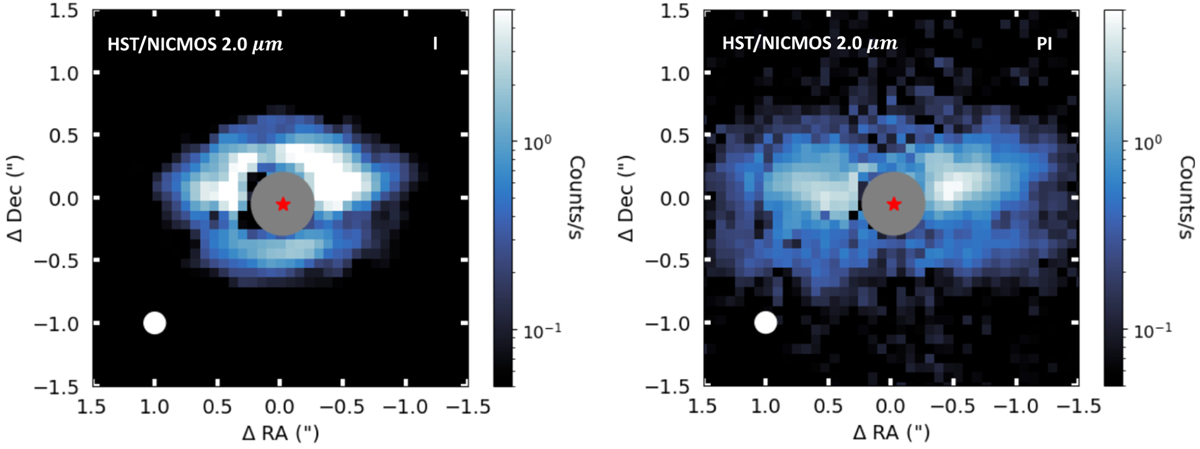
Observations of PDS 453. The size of the corresponding PSF is shown in the bottom left corner of each panel, and the gray circles represent the size of coronagraphic masks. The red star corresponds to the position of the bright central point source. Left panel: HST/NICMOS scattered-light total intensity image at 2 µm shown using a logarithmic stretch. Right panel: HST/NICMOS scattered-light polarized intensity image 2 µm shown using a logarithmic stretch.
Current usage metrics show cumulative count of Article Views (full-text article views including HTML views, PDF and ePub downloads, according to the available data) and Abstracts Views on Vision4Press platform.
Data correspond to usage on the plateform after 2015. The current usage metrics is available 48-96 hours after online publication and is updated daily on week days.
Initial download of the metrics may take a while.