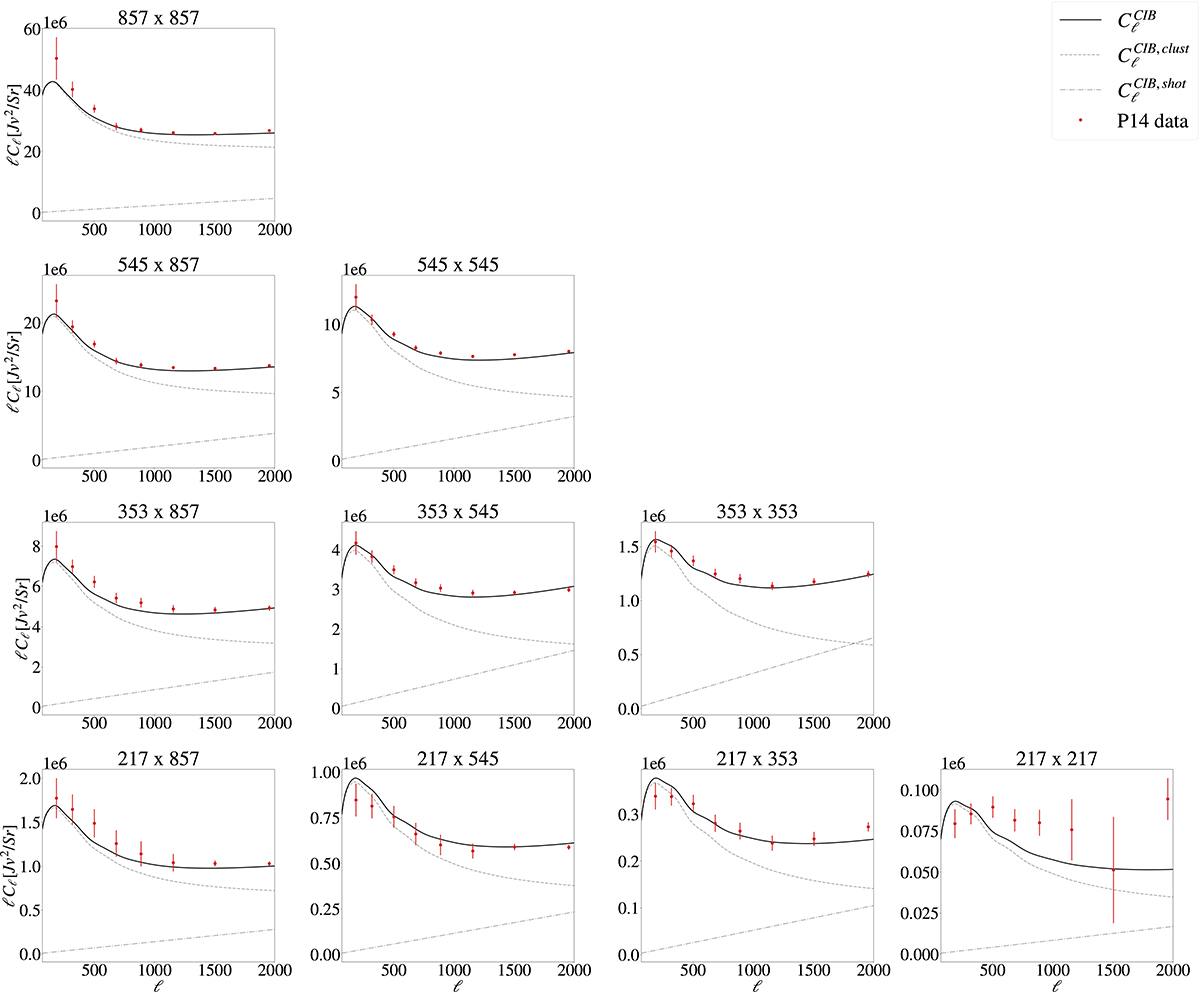
Fig. 3.
Download original image
Comparison between P14 data and the model predictions obtained with the best-fit parameters in Table 2. The CIB power spectrum, the clustering term and the shot noise term predicted by the model are represented with the solid black, the dashed gray and the dot-dashed gray curves, respectively. P14 data with their error bars are represented in red.
Current usage metrics show cumulative count of Article Views (full-text article views including HTML views, PDF and ePub downloads, according to the available data) and Abstracts Views on Vision4Press platform.
Data correspond to usage on the plateform after 2015. The current usage metrics is available 48-96 hours after online publication and is updated daily on week days.
Initial download of the metrics may take a while.