Fig. 2.
Download original image
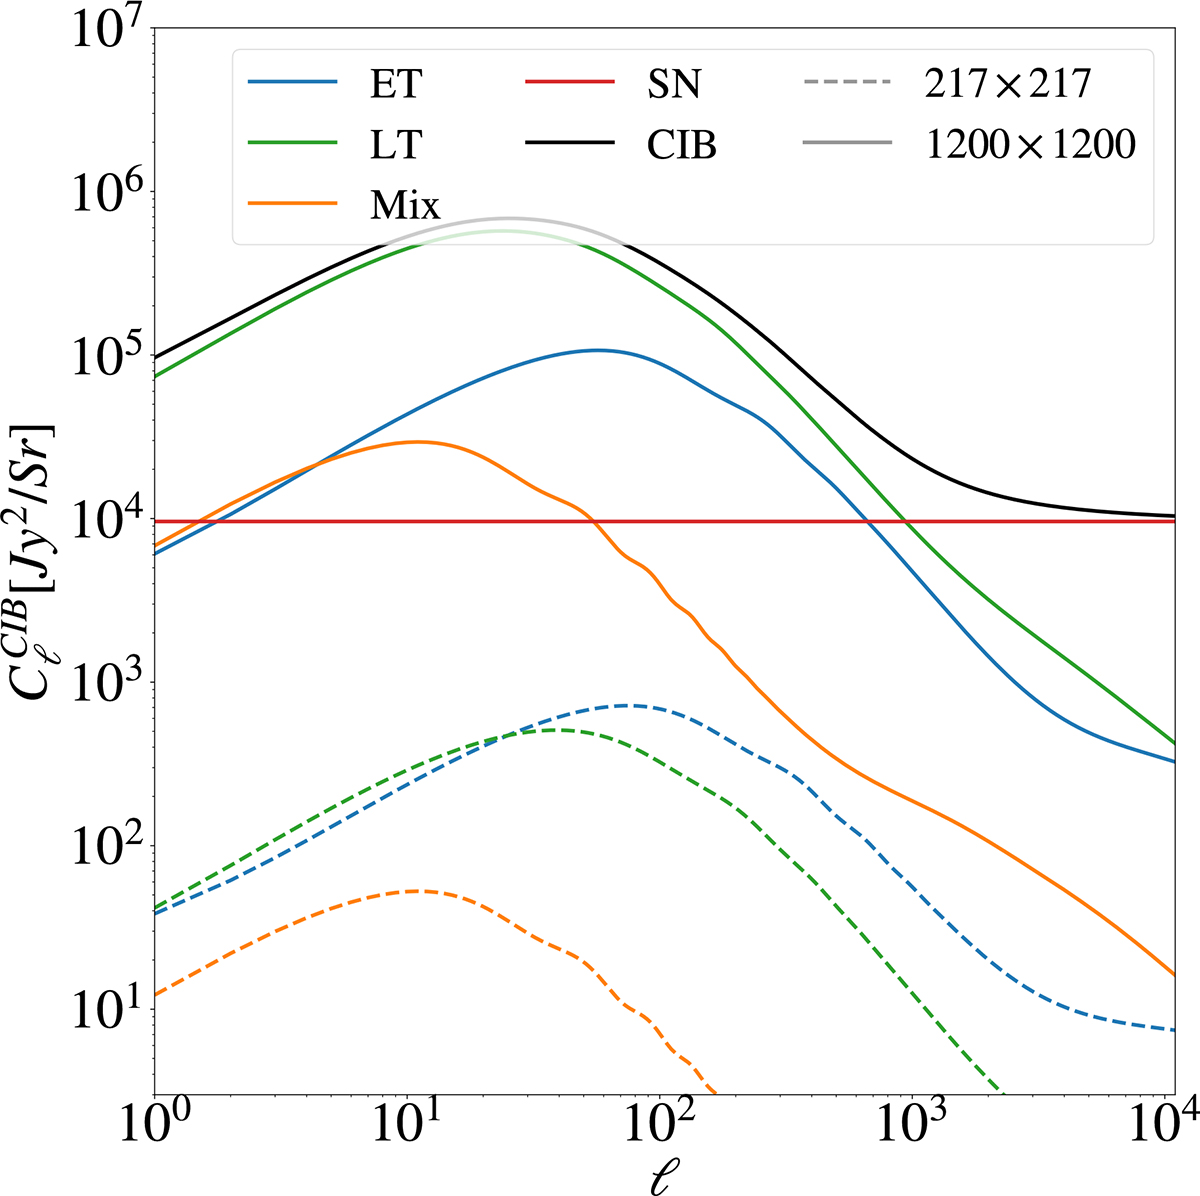
Different contributions to the CIB power spectrum as predicted by our model, for two different frequency combinations: 217 × 217 GHz (dashed curves), and 1200 × 1200 GHz (solid curves). In both cases, the contribution from early-type (ET) galaxies is in blue, for late-type (LT) galaxies in green and the mixing between the two galaxy populations in orange. The shot noise term is the flat contribution shown in red. The total CIB power spectrum (Eq. 49) is shown in black. The values of the model parameters used to produce these curves are: ![]() ,
, ![]() ,
, ![]() ,
, ![]() , SN217 = 16 and SN1200 = 9833.
, SN217 = 16 and SN1200 = 9833.
Current usage metrics show cumulative count of Article Views (full-text article views including HTML views, PDF and ePub downloads, according to the available data) and Abstracts Views on Vision4Press platform.
Data correspond to usage on the plateform after 2015. The current usage metrics is available 48-96 hours after online publication and is updated daily on week days.
Initial download of the metrics may take a while.