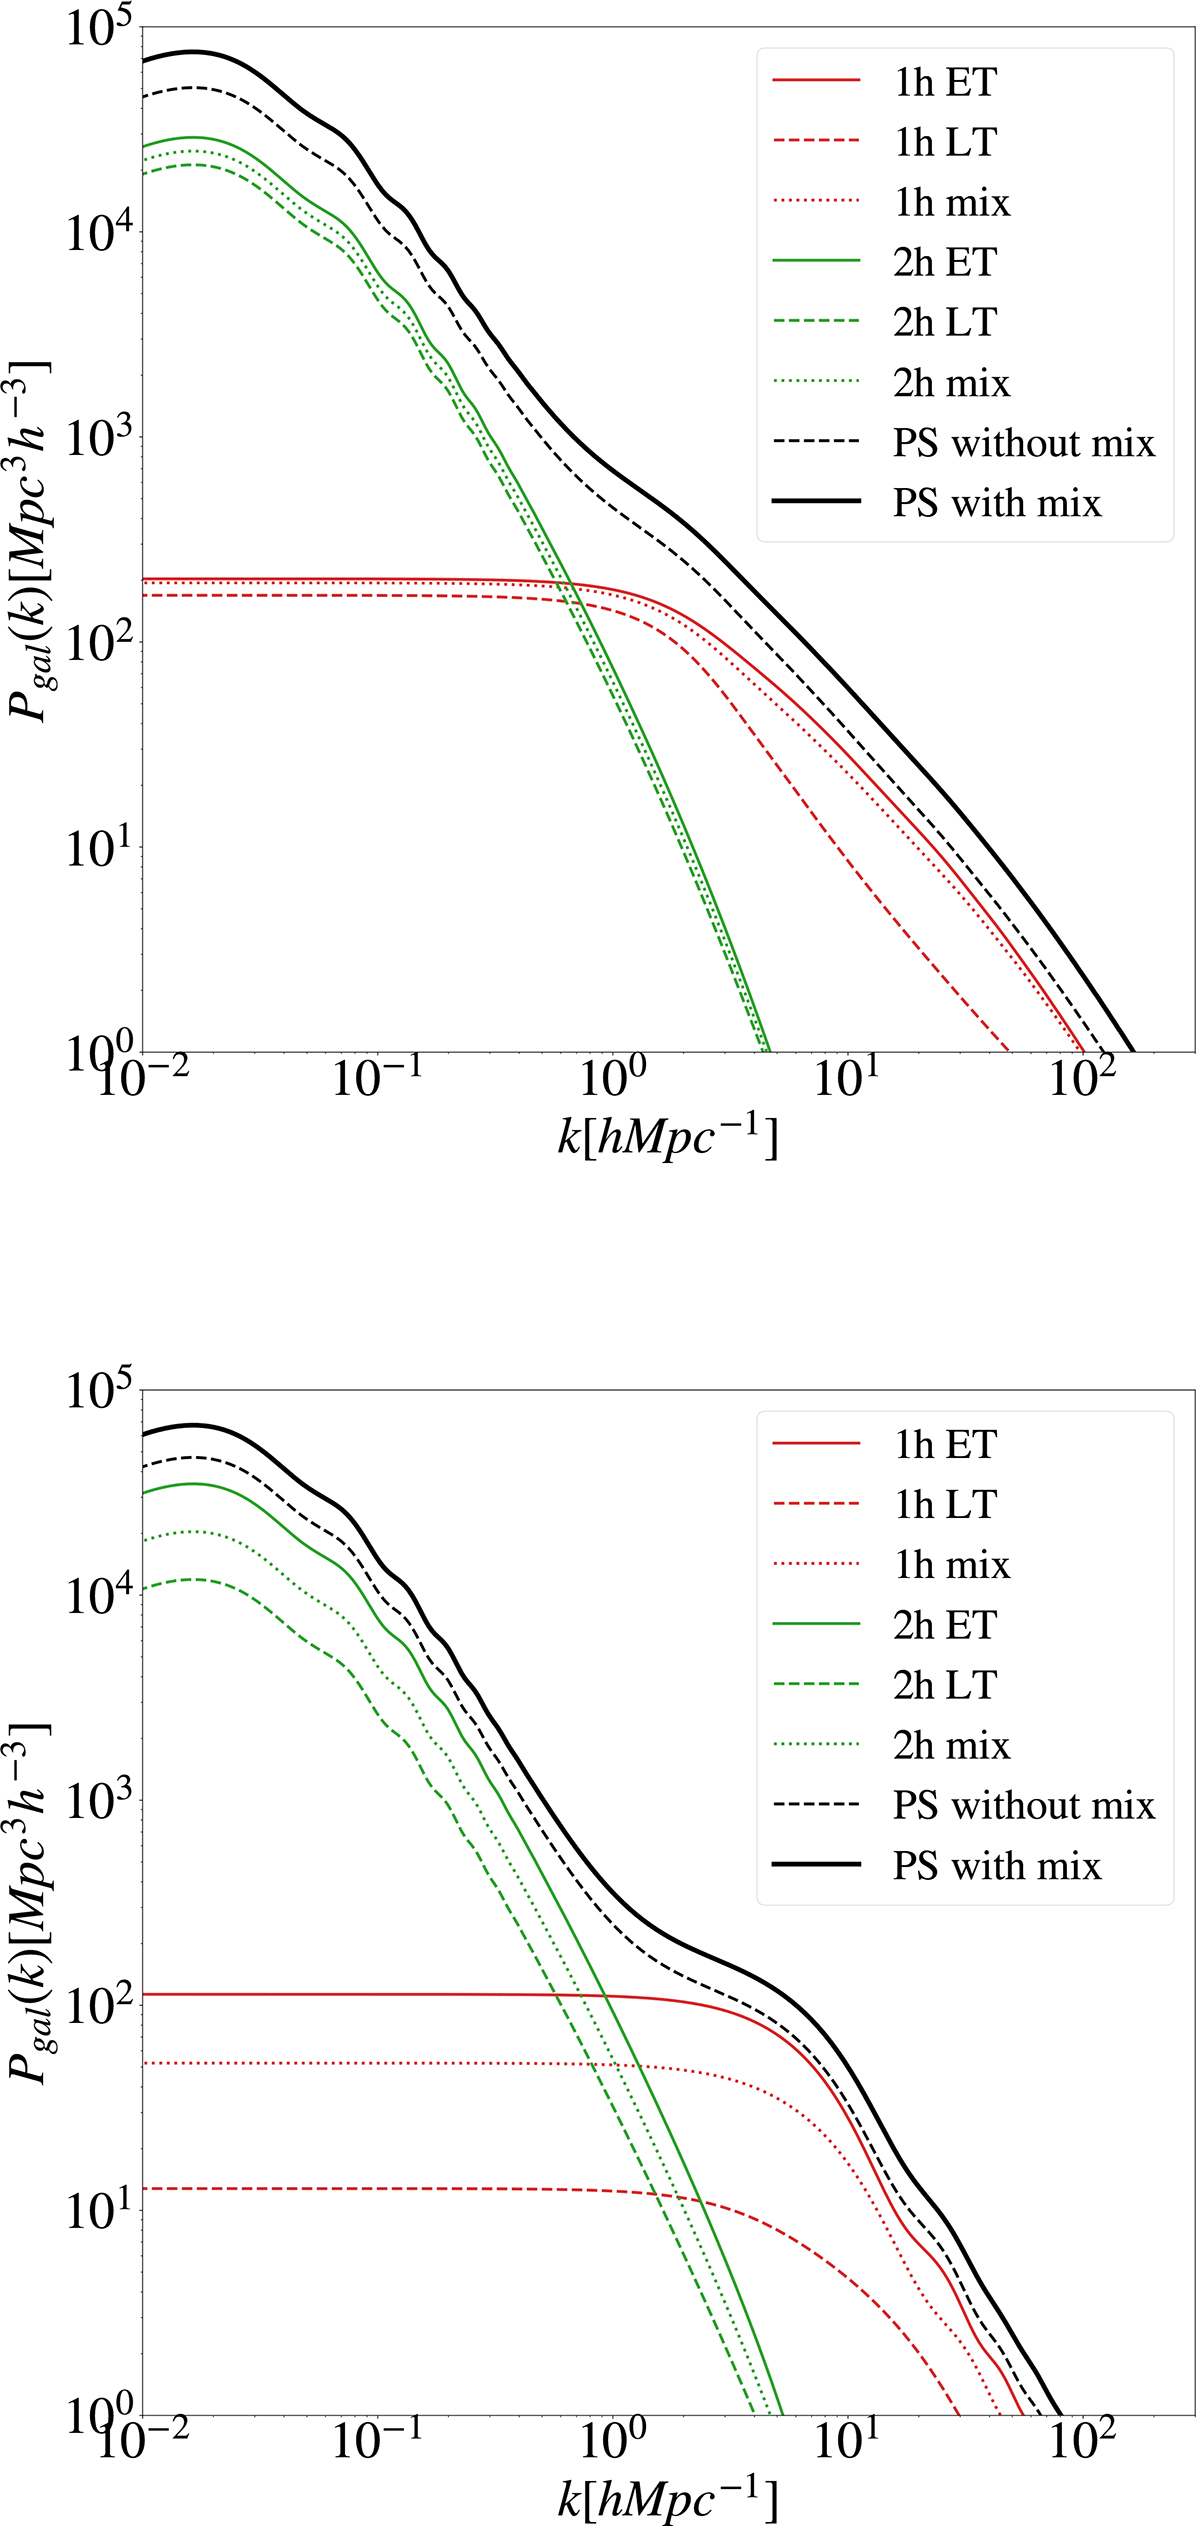
Fig. 1.
Download original image
Galaxy power spectrum, evaluated at redshifts z = 0.001 (upper panel) and z = 2.0 (lower panel), broken down into the contributions from one-halo (1h) and two-halo (2h) terms, with (solid) and without (dashed) including the mixing terms between early-type (ET) and late-type (LT) galaxy populations. Red curves: 1h terms from ET (solid), LT (dashed) galaxies, and the mix (1h mix, dotted) between the two. Green curves: 2h terms from ET (solid), LT (dashed) galaxies and the mixing (2h mix, dotted) between the two. Black dashed curve: galaxy power spectrum without mixing terms between the two galaxy populations (PS without mix). Black solid curve: galaxy power spectrum with mixing terms (PS with mix).
Current usage metrics show cumulative count of Article Views (full-text article views including HTML views, PDF and ePub downloads, according to the available data) and Abstracts Views on Vision4Press platform.
Data correspond to usage on the plateform after 2015. The current usage metrics is available 48-96 hours after online publication and is updated daily on week days.
Initial download of the metrics may take a while.