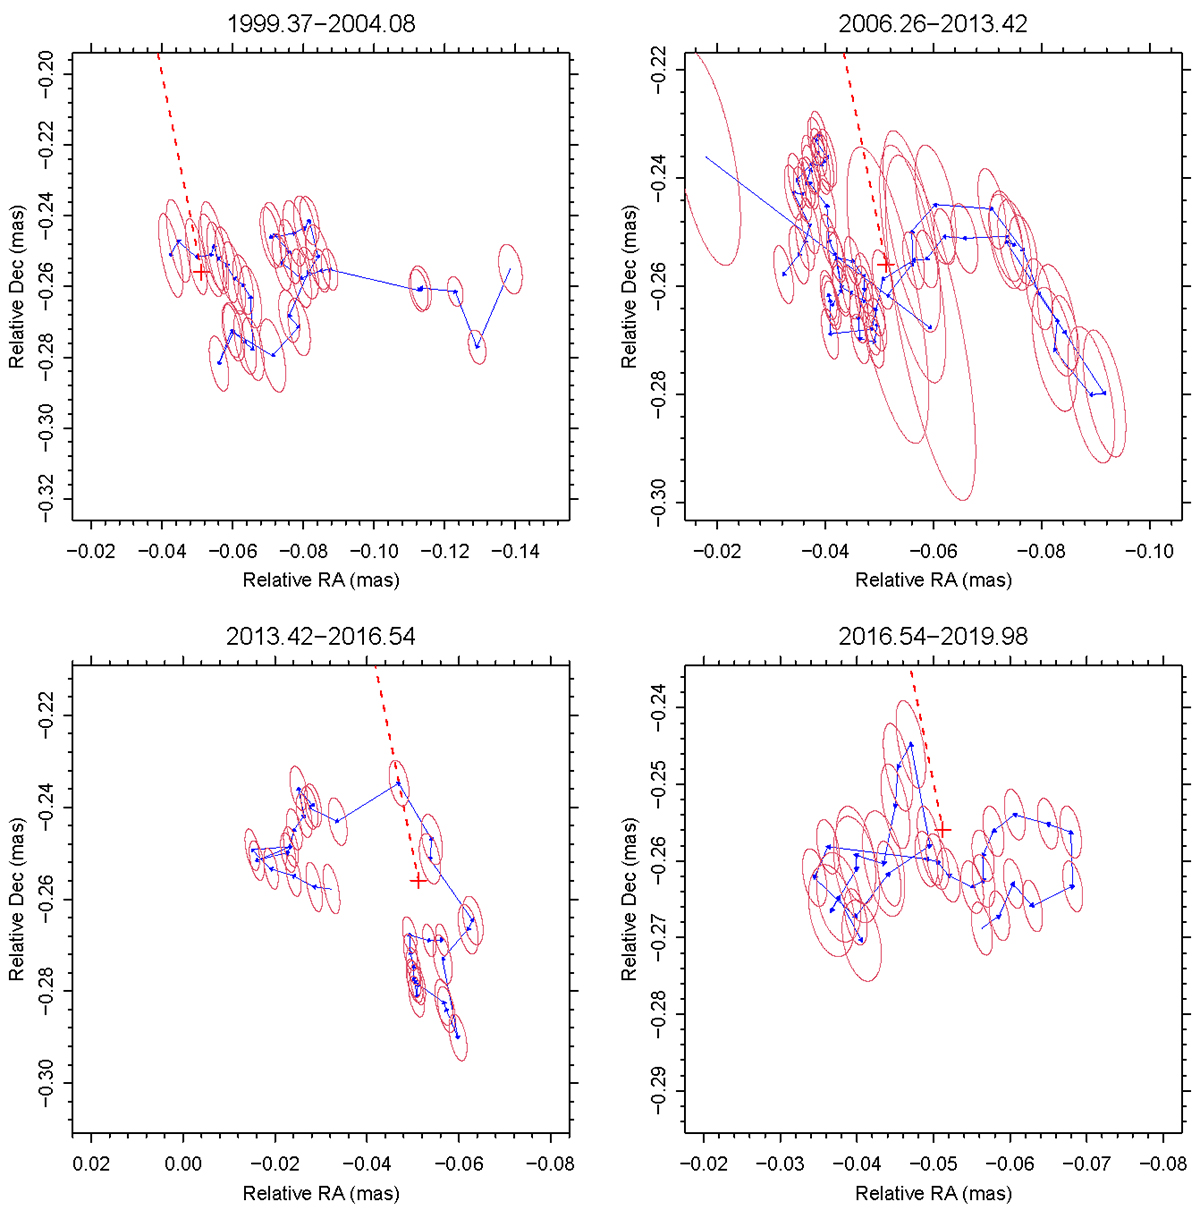
Fig. 4.
Download original image
Trajectory of C7 smoothed by the moving average procedure on a timescale of 1 yr (blue line). For clarity, the smoothed trajectory is represented for four time periods: 1999.37–2004.08, 2006.26–2013.42, 2013.42–2016.61, and 2016.61–2019.98. Average asymmetric positioning errors are shown by ellipses. The median scatter position over the whole time range from 1999.37 to 2019.98 is marked with a red plus sign. The dashed red line is the central axis of the jet connecting the median position of C7 and the radio core.
Current usage metrics show cumulative count of Article Views (full-text article views including HTML views, PDF and ePub downloads, according to the available data) and Abstracts Views on Vision4Press platform.
Data correspond to usage on the plateform after 2015. The current usage metrics is available 48-96 hours after online publication and is updated daily on week days.
Initial download of the metrics may take a while.