Fig. 5
Download original image
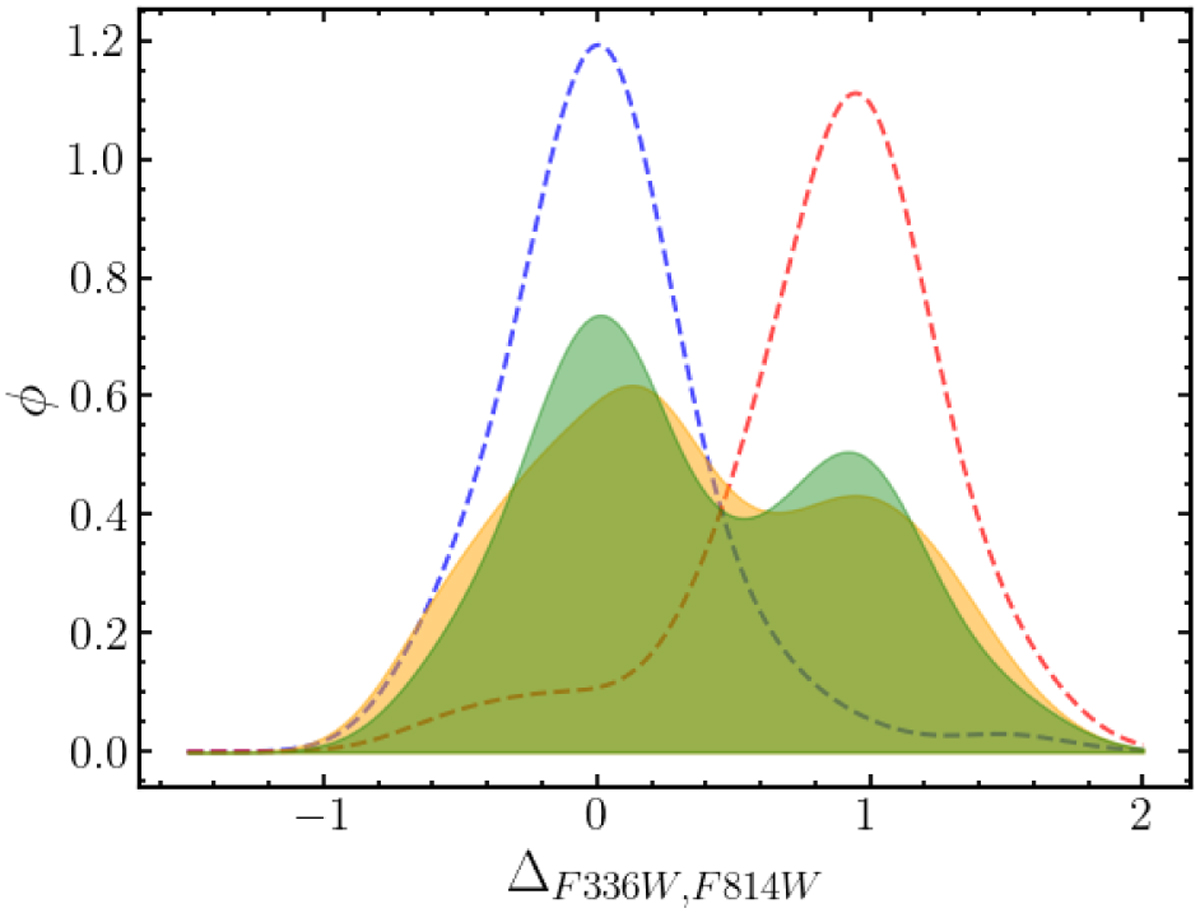
Comparison between the observed ΔF336W,F814W kernel distribution of the NGC 1850 binaries (yellow-shaded area) and the corresponding distribution derived from the best-fitting simulated CMD (green-shaded area). The dashed blue and red lines indicate the distributions of binaries in a simulated CMD that hosts only bMS and rMS binaries, respectively.
Current usage metrics show cumulative count of Article Views (full-text article views including HTML views, PDF and ePub downloads, according to the available data) and Abstracts Views on Vision4Press platform.
Data correspond to usage on the plateform after 2015. The current usage metrics is available 48-96 hours after online publication and is updated daily on week days.
Initial download of the metrics may take a while.