Fig. 4
Download original image
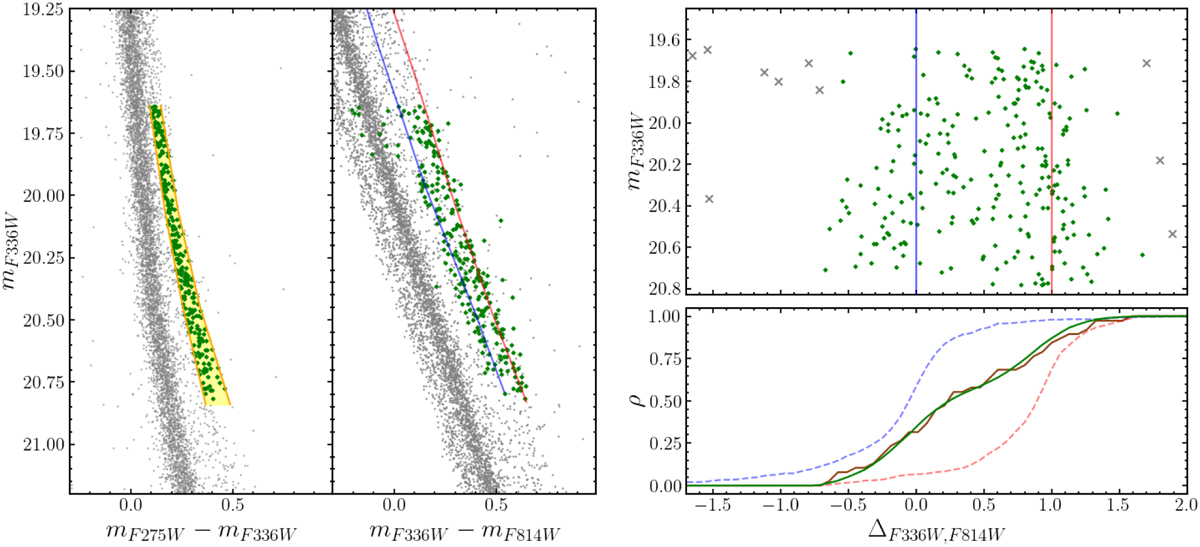
Simulated mF336W vs. mF275W − mF336W (left) and mF336W vs. mF336W − mF814W CMDs (middle) of NGC 1850 that better reproduce the ΔF336W,F814W cumulative distribution of the observed binaries. The verticalized mF336W vs. ΔF336W,F814W diagram is plotted on the top-right panel. The probable binaries, selected from the left-panel CMD, are colored green. Like in Fig. 3, the orange lines in the left-panel CMD mark the boundaries of the yellow area, whereas the fiducial lines of the equal-luminosity bMS and rMS binaries are indicated with continuous blue and red lines, respectively. The bottom-right panel compares the ΔF336W,F814W cumulative distribution of the observed binaries (brown line) with the corresponding distribution for the simulated binaries. For completeness, we use the dashed blue and red lines to show the cumulative distributions derived from the simulated CMDs that host only bMS and rMS binaries, respectively.
Current usage metrics show cumulative count of Article Views (full-text article views including HTML views, PDF and ePub downloads, according to the available data) and Abstracts Views on Vision4Press platform.
Data correspond to usage on the plateform after 2015. The current usage metrics is available 48-96 hours after online publication and is updated daily on week days.
Initial download of the metrics may take a while.