Open Access
Fig. 7
Download original image
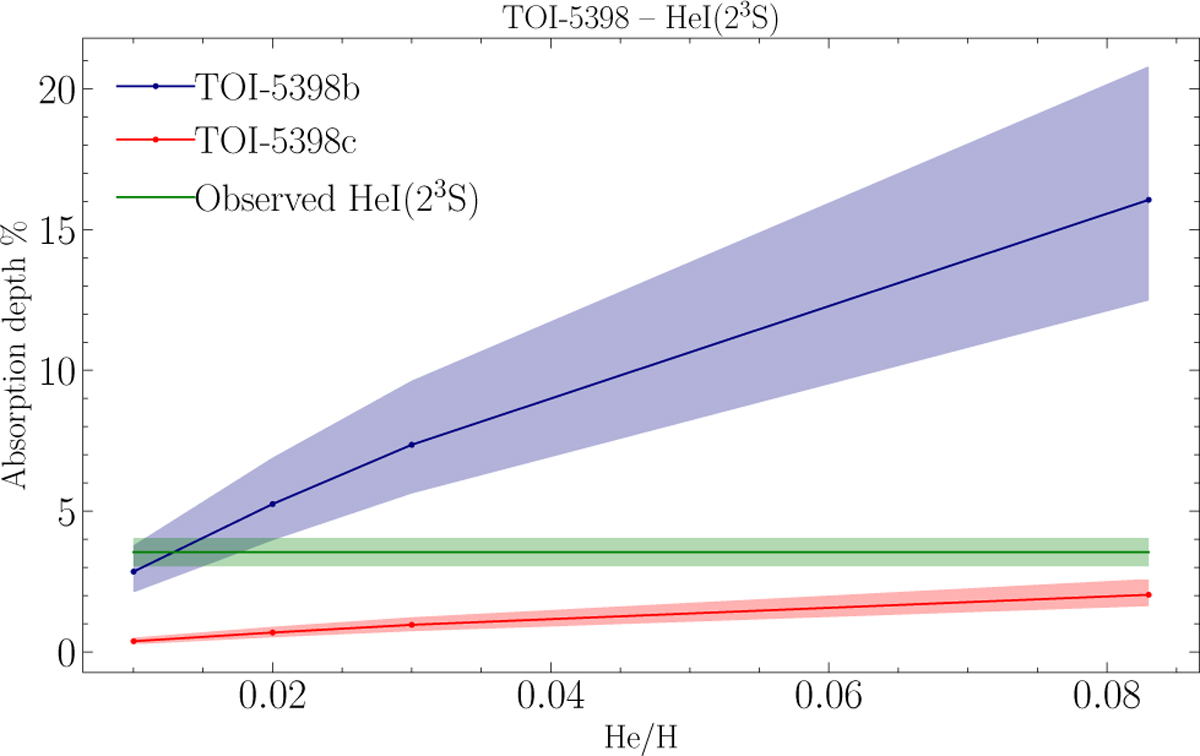
He I simulated absorption profiles for both planets changing the He/H number abundance. The green line corresponds to the He I observed signal with lσ error bars given in Table 3. The blue and red bands correspond to the simulations obtained for the two planets, varying the X-ray luminosity by a factor of two.
Current usage metrics show cumulative count of Article Views (full-text article views including HTML views, PDF and ePub downloads, according to the available data) and Abstracts Views on Vision4Press platform.
Data correspond to usage on the plateform after 2015. The current usage metrics is available 48-96 hours after online publication and is updated daily on week days.
Initial download of the metrics may take a while.