Fig. 6
Download original image
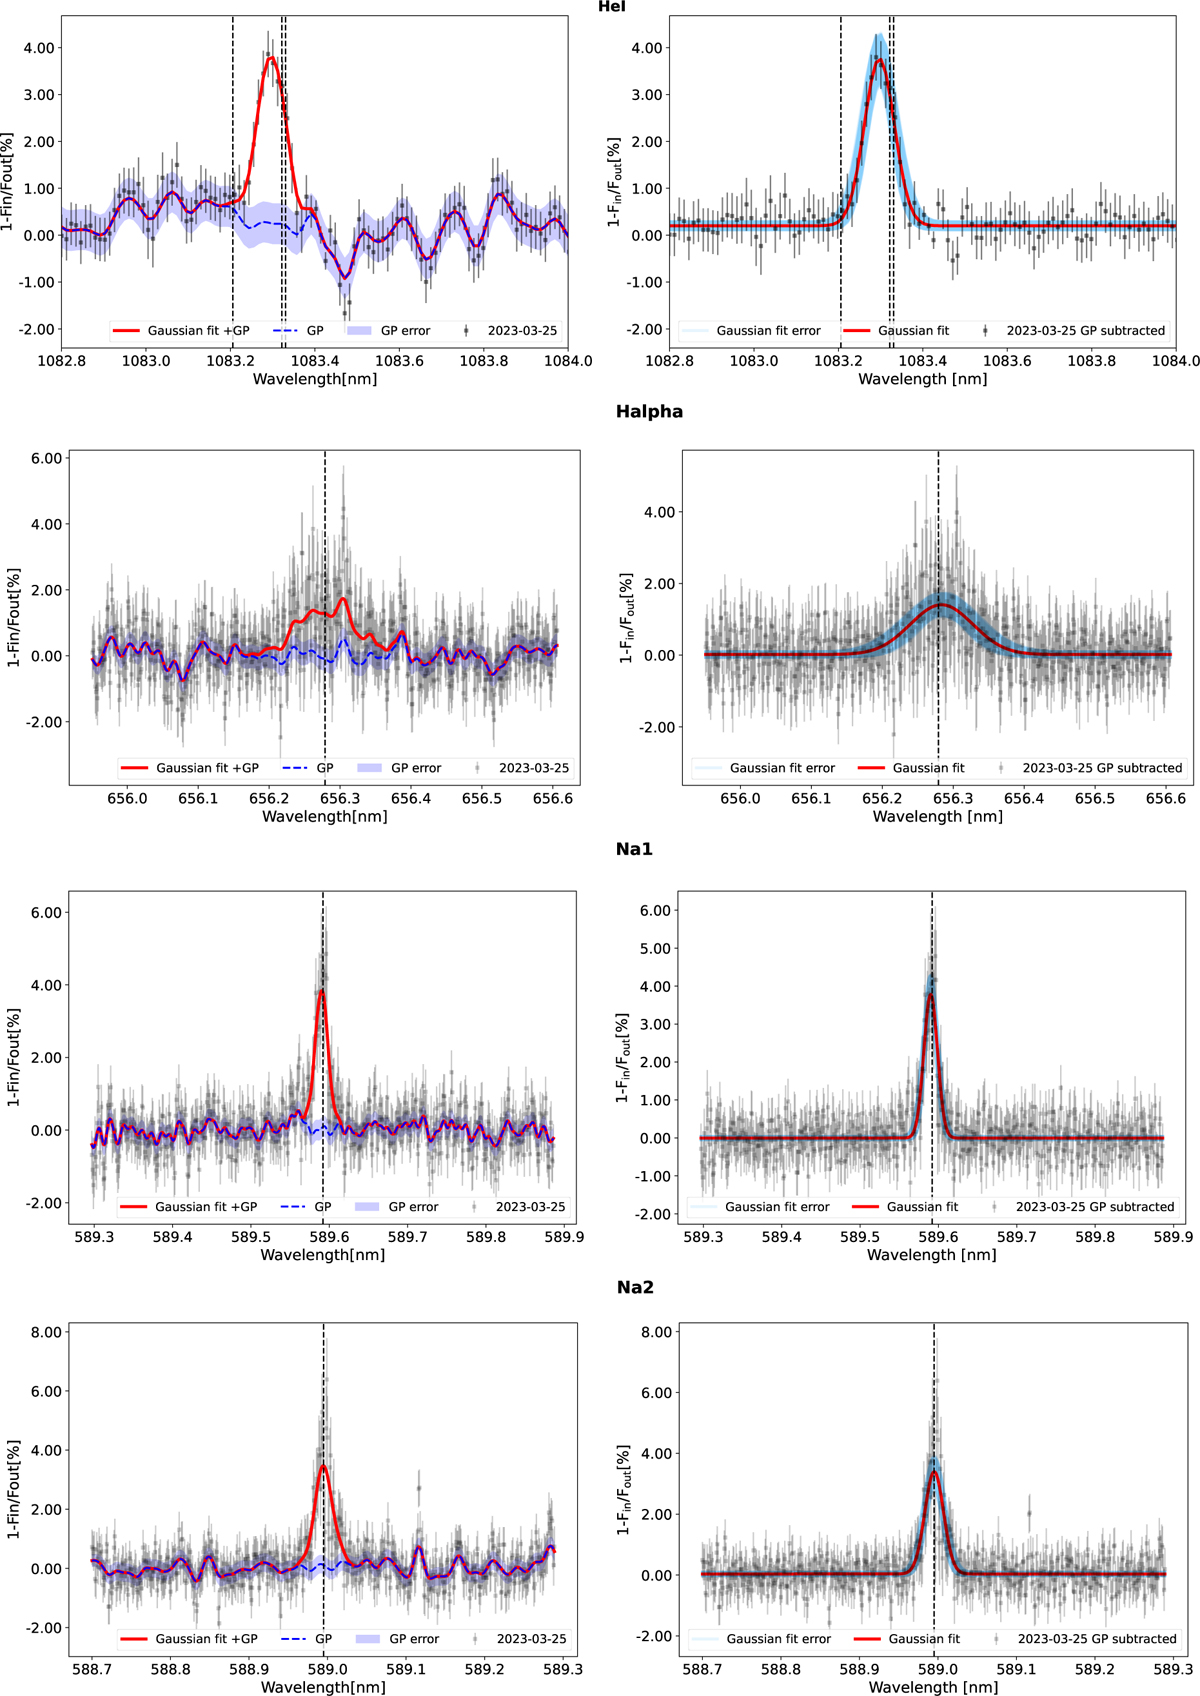
Transmission spectra of He I triplet and Hα and Na I doublet after GP correction. For each investigated line, the GP correction is shown. Left panel: transmission spectrum centred on the line (in the planet rest frame) with the GP regression model overplotted, along with the lσ uncertainty intervals (in blue), and the Gaussian+GP model (in red). Right panel: final transmission spectrum after removing the GP model. Vertical dotted black lines indicate the position of the investigated line. The error intervals for the Gaussian fit were computed by displaying 1000 Gaussian fits within the lσ uncertainties of the derived parameters, spanning the 16%–84% quantiles.
Current usage metrics show cumulative count of Article Views (full-text article views including HTML views, PDF and ePub downloads, according to the available data) and Abstracts Views on Vision4Press platform.
Data correspond to usage on the plateform after 2015. The current usage metrics is available 48-96 hours after online publication and is updated daily on week days.
Initial download of the metrics may take a while.