Fig. 5
Download original image
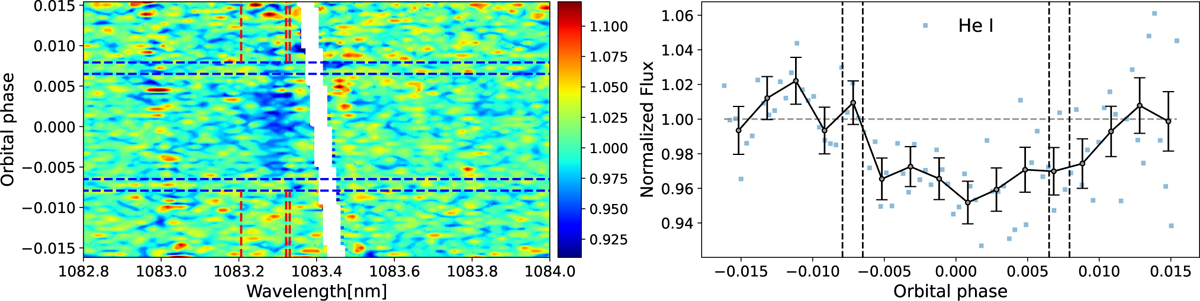
Analysis results for the He I triplet. Left panel: 2D maps of transmission spectra in the planet rest frame in the region of the He I triplet, as a function of wavelength and planetary orbital phase. The contact points, t1, t2, t3, and t4, are marked with horizontal blue lines. The regions affected by OH contamination are masked. Some residuals are left at the position of the Si line (~1083 nm). This is due to the depth of the line, which can cause difficulties in spectral extraction (see, e.g., Krishnamurthy et al. 2023). Dashed red lines mark the position of the He I lines. Right panel: light curve in the planet rest frame computed in a bandpass of 0.075 nm (equivalent to ~20 km s−1). Black points were computed with a phase bin of 0.002. Vertical dashed black lines indicate the position of the transit contact points, t1, t2, t3, and t4.
Current usage metrics show cumulative count of Article Views (full-text article views including HTML views, PDF and ePub downloads, according to the available data) and Abstracts Views on Vision4Press platform.
Data correspond to usage on the plateform after 2015. The current usage metrics is available 48-96 hours after online publication and is updated daily on week days.
Initial download of the metrics may take a while.