Fig. A.4
Download original image
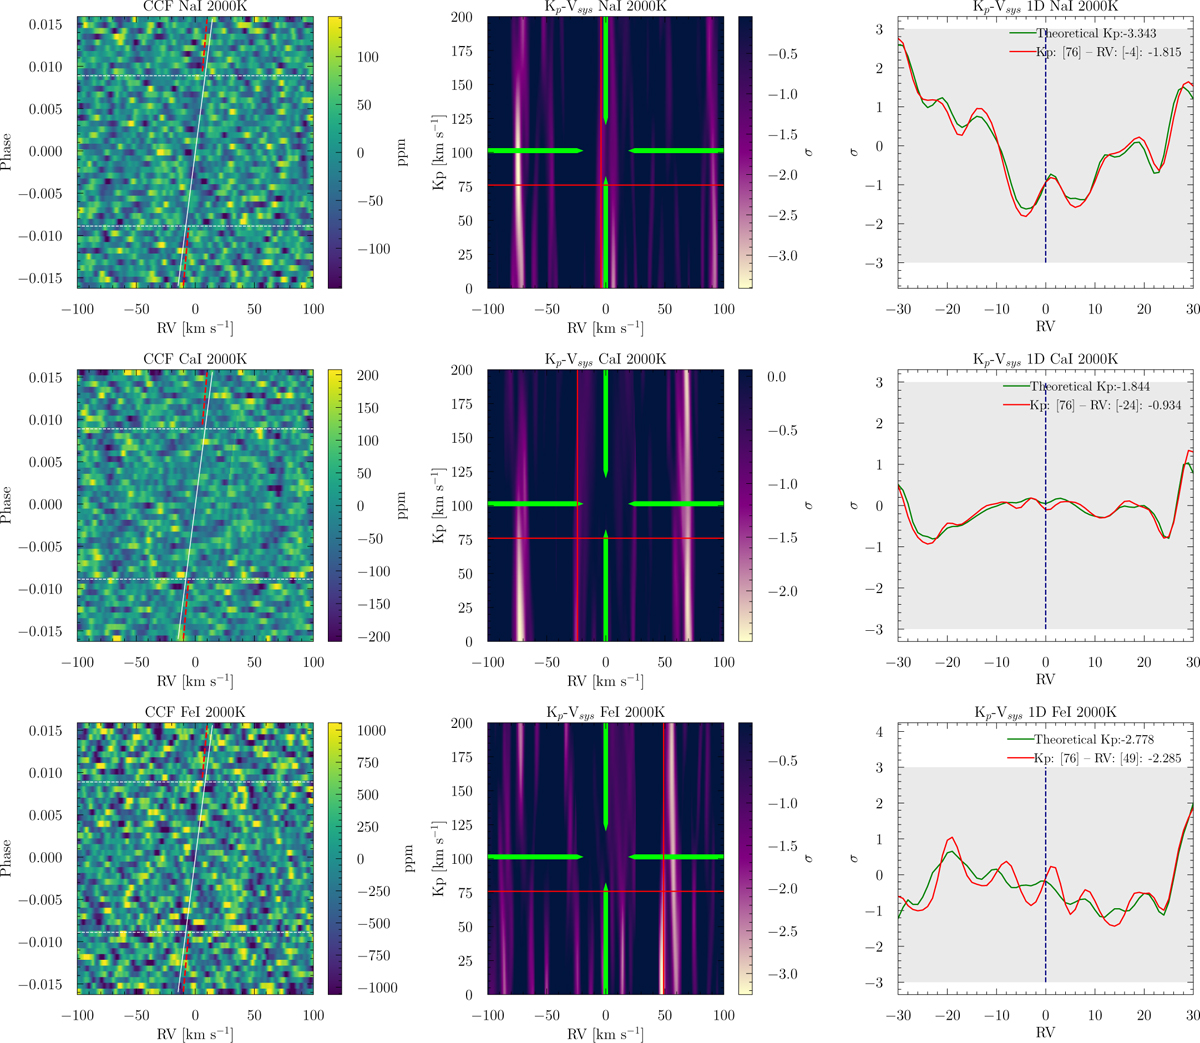
Cross-correlation and Kp-Vsys maps of Na I, Ca I, and Fe I obtained with the Kitzmann et al. (2023) templates at 2000K. In the first column the CCF are depicted in terms of ppm. The dotted horizontal lines indicate the T1 and T4 contact points, while the red dashed line is the planetary trace. The Doppler shadow follows the white slanted line. Second columns are the Kp-Vsys maps. The planetary signal is expected to be limited between the green pointer in the middle of the figures, while the red lines point at the minimum value of the Kp-Vsys between Kp 75 km s−1, 125 km s−1 and RV -50 km s−1, +50 km s−1. The last column is the Kp-Vsys 1D map evaluated at the Kp minimum value. The grey region is the 3σ edge, while the vertical navy dashed line refers to the RV 0 km s−1.
Current usage metrics show cumulative count of Article Views (full-text article views including HTML views, PDF and ePub downloads, according to the available data) and Abstracts Views on Vision4Press platform.
Data correspond to usage on the plateform after 2015. The current usage metrics is available 48-96 hours after online publication and is updated daily on week days.
Initial download of the metrics may take a while.